Fig. 1.
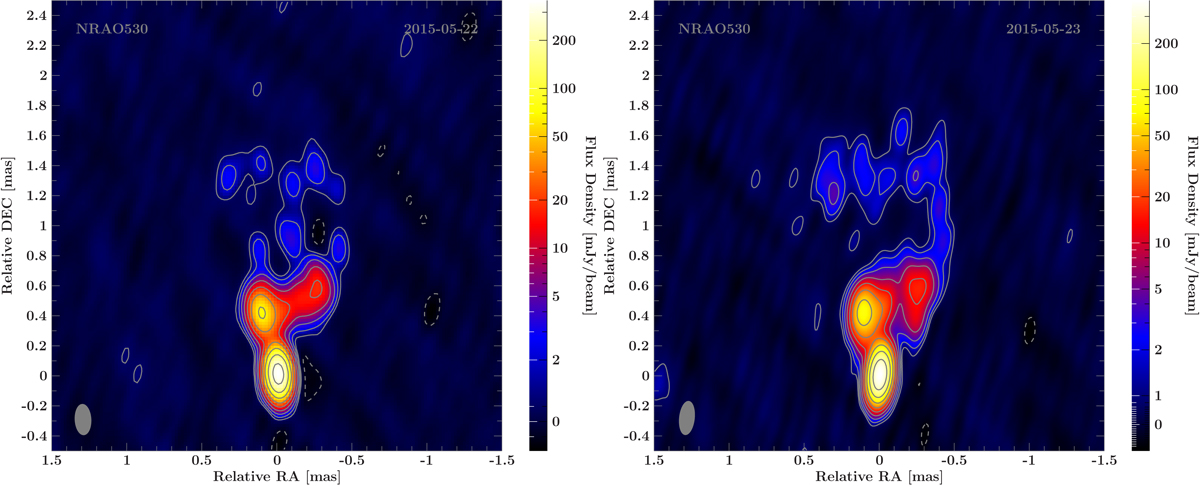
Naturally weighted 86 GHz images of NRAO 530. Left panel: using data of project BF114A (2015-05-22) with VLBA and LMT. Right panel: using data of project BF114B (2015-05-23) with VLBA, LMT and GBT. The contours indicate the flux density level (dashed-grey contours are negative), scaled logarithmically and separated by a factor of two, with the lowest level set to the 3σ-noise level. The synthesized array beam is shown as a grey ellipse in the lower left corner. Image parameters are listed in Table 1.
Current usage metrics show cumulative count of Article Views (full-text article views including HTML views, PDF and ePub downloads, according to the available data) and Abstracts Views on Vision4Press platform.
Data correspond to usage on the plateform after 2015. The current usage metrics is available 48-96 hours after online publication and is updated daily on week days.
Initial download of the metrics may take a while.