Fig. 6.
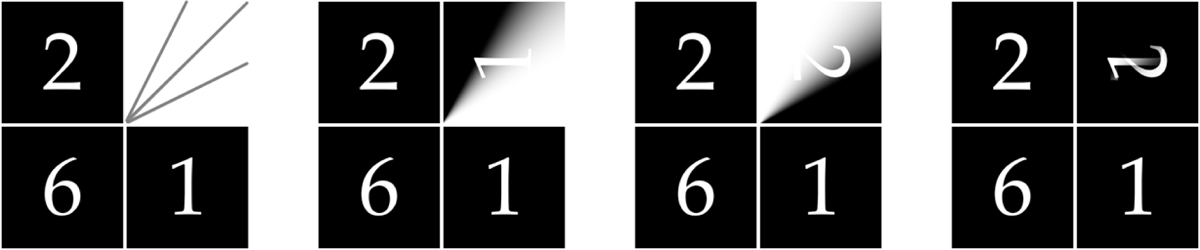
“Missing” square between faces 1 and 2 is divided into four triangles of equal size, separated by the lines 2x = y, x = y, and x = 2y, as seen on the left. The two images in the middle reveal how the rotated faces 1 and 2 are separately weighted along those segments. The data of face 1 have full weight (black) on the outer triangle adjacent to face 2, and no weight (white) on the other outer triangle, while the data of face 2 are treated conversely. A smooth transition is provided by the weights on the triangles in between. The sum of the weighted faces is used to fill the gap, as demonstrated in the right-most illustration.
Current usage metrics show cumulative count of Article Views (full-text article views including HTML views, PDF and ePub downloads, according to the available data) and Abstracts Views on Vision4Press platform.
Data correspond to usage on the plateform after 2015. The current usage metrics is available 48-96 hours after online publication and is updated daily on week days.
Initial download of the metrics may take a while.