Fig. 4.
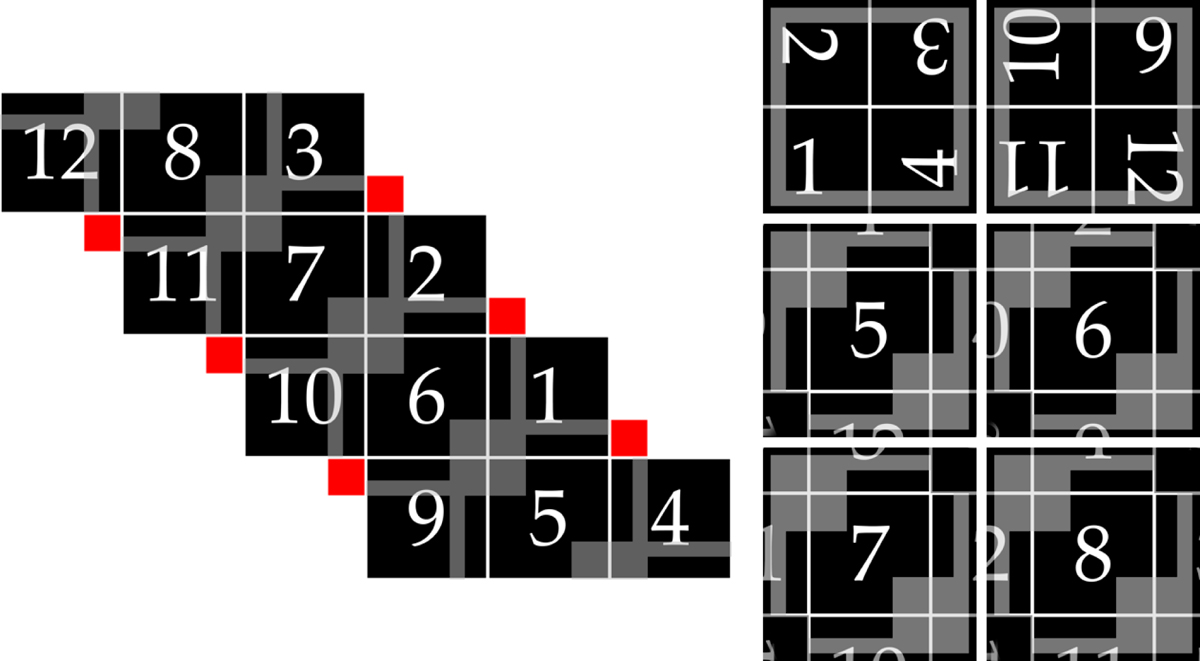
Left panel: twelve squares corresponding to the faces of the HEALPix framework (see Fig. 1) arranged as a net in the plane. The areas that are covered by multiple of the extended faces – the transition zones – are displayed in gray. The areas where pixels are “missing” are displayed in red. Right panel: six extended faces produced by the patchwork procedure. The two polar faces form the top row, followed by the four equatorial faces below. The shaded area around the transition zone of each composite face indicates the margin, which is later discarded.
Current usage metrics show cumulative count of Article Views (full-text article views including HTML views, PDF and ePub downloads, according to the available data) and Abstracts Views on Vision4Press platform.
Data correspond to usage on the plateform after 2015. The current usage metrics is available 48-96 hours after online publication and is updated daily on week days.
Initial download of the metrics may take a while.