Fig. 2.
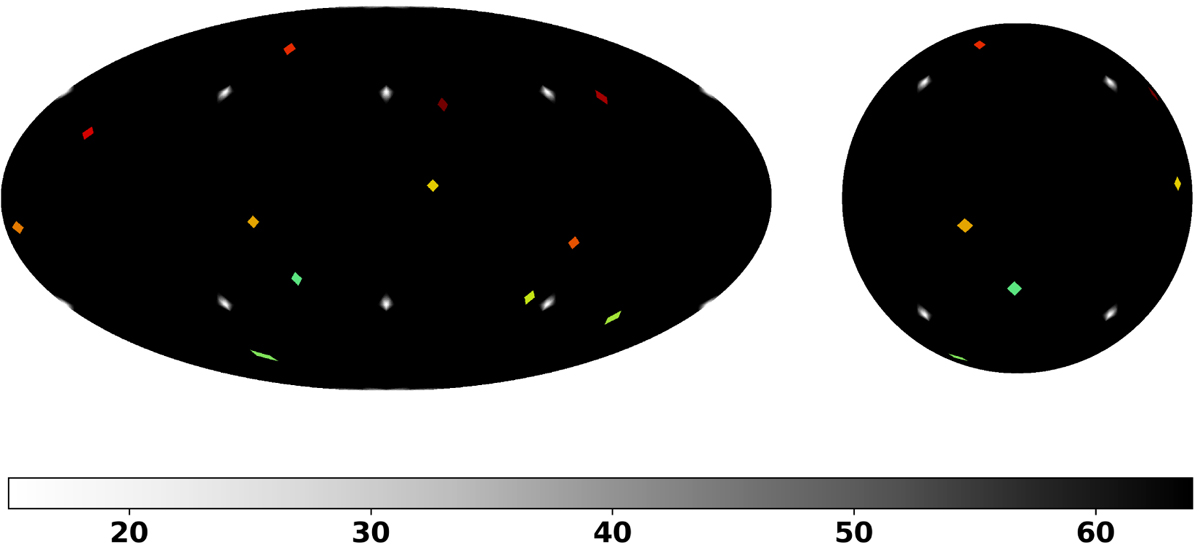
Example of our covering of the sphere with overlapping patches based on HEALPix neighborhoods for Nside = 128 and patch width q = 8 (note that in our numerical experiments, Nside = 2048 and the patch width is either q = 8 or q = 12). Several randomly selected patches on the sphere are also represented in color. The plotted value in gray indicates the number of overlapping patches including each pixel. Because the patch width is usually small with respect to the number of pixels per face, the number of overlapping patches varies in small regions around the pixels that only have seven neighbors.
Current usage metrics show cumulative count of Article Views (full-text article views including HTML views, PDF and ePub downloads, according to the available data) and Abstracts Views on Vision4Press platform.
Data correspond to usage on the plateform after 2015. The current usage metrics is available 48-96 hours after online publication and is updated daily on week days.
Initial download of the metrics may take a while.