Open Access
Fig. 1.
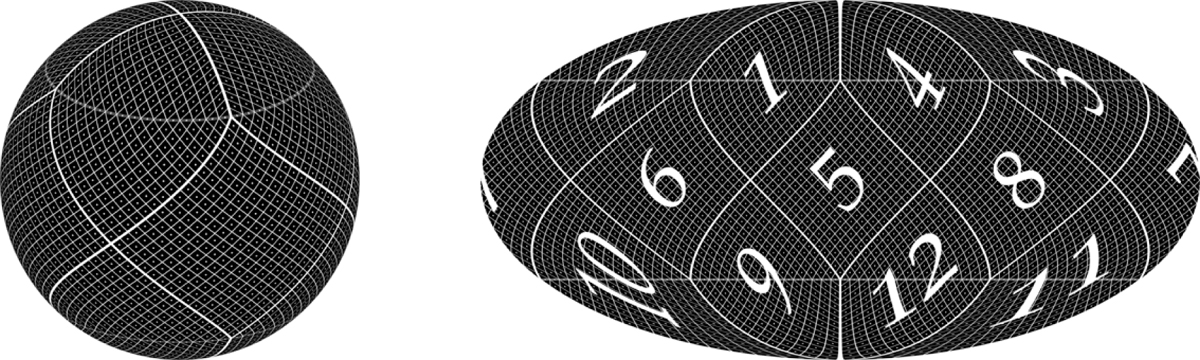
HEALPix grid (visualizing Nside = 16) in orthographic projection on the left and Mollweide projection on the right. Faint lines indicate the circles of latitude ![]() . The right image also introduces the numbering of the faces, used in the following illustrations.
. The right image also introduces the numbering of the faces, used in the following illustrations.
Current usage metrics show cumulative count of Article Views (full-text article views including HTML views, PDF and ePub downloads, according to the available data) and Abstracts Views on Vision4Press platform.
Data correspond to usage on the plateform after 2015. The current usage metrics is available 48-96 hours after online publication and is updated daily on week days.
Initial download of the metrics may take a while.