Fig. 5
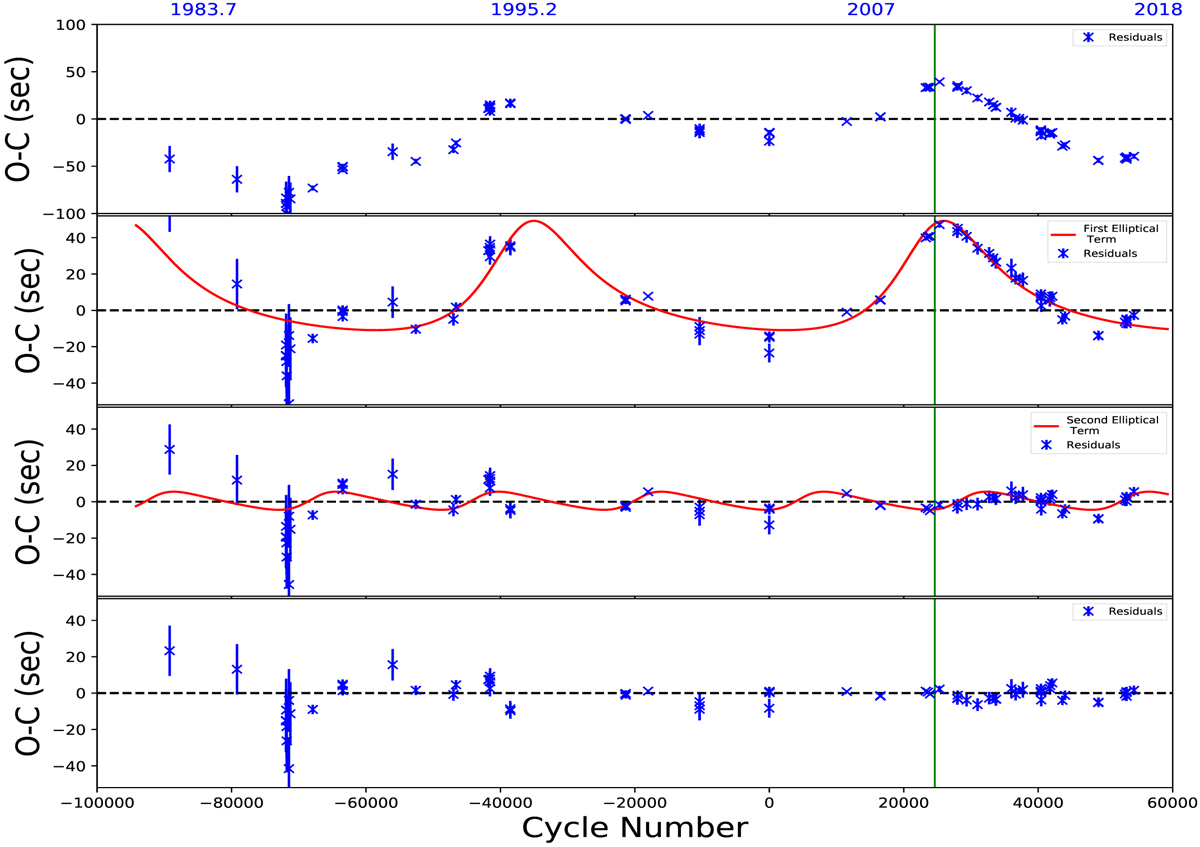
Formal best O–C diagram of UZ For, based on new parameters shown in Table 2, after successive subtraction of the three terms comprising our new eclipse ephemeris. Top panel: O–C after subtraction of the linear term. Second panel: O–C after subtraction of the quadratic term with the first elliptical term overplotted (solid red curve). Third panel:O–C after subtraction of the first elliptical term with the second elliptical term overplotted (solid red curve). Bottom panel: final O–C residuals after subtraction of the second elliptical term. The vertical green line separates the eclipse times from literature (to the left) and our new eclipse times (to the right).
Current usage metrics show cumulative count of Article Views (full-text article views including HTML views, PDF and ePub downloads, according to the available data) and Abstracts Views on Vision4Press platform.
Data correspond to usage on the plateform after 2015. The current usage metrics is available 48-96 hours after online publication and is updated daily on week days.
Initial download of the metrics may take a while.