Free Access
Fig. 2
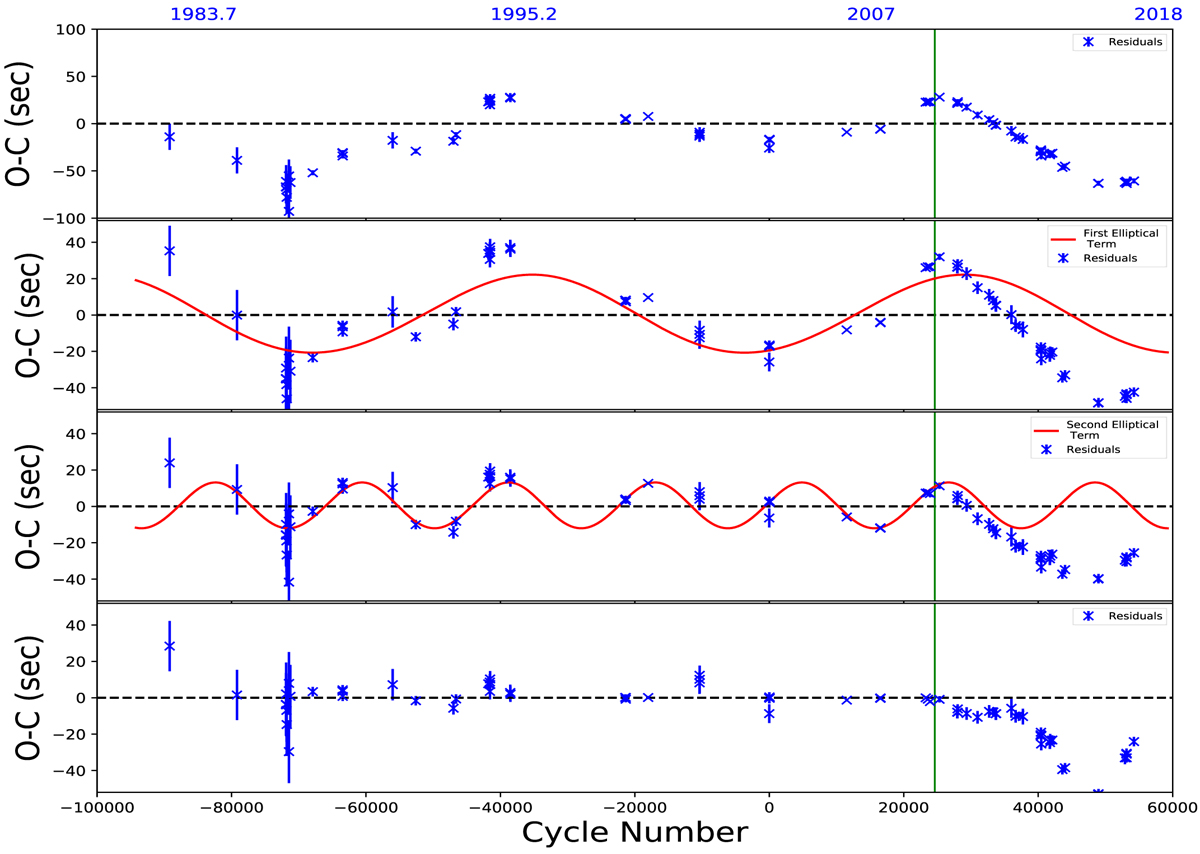
O–C diagram of UZ For from Paper I but with new eclipses added. The vertical green lines separate the eclipse times from literature (to the left) and our new eclipse times (to the right). See text for more details.
Current usage metrics show cumulative count of Article Views (full-text article views including HTML views, PDF and ePub downloads, according to the available data) and Abstracts Views on Vision4Press platform.
Data correspond to usage on the plateform after 2015. The current usage metrics is available 48-96 hours after online publication and is updated daily on week days.
Initial download of the metrics may take a while.