Free Access
Fig. 5.
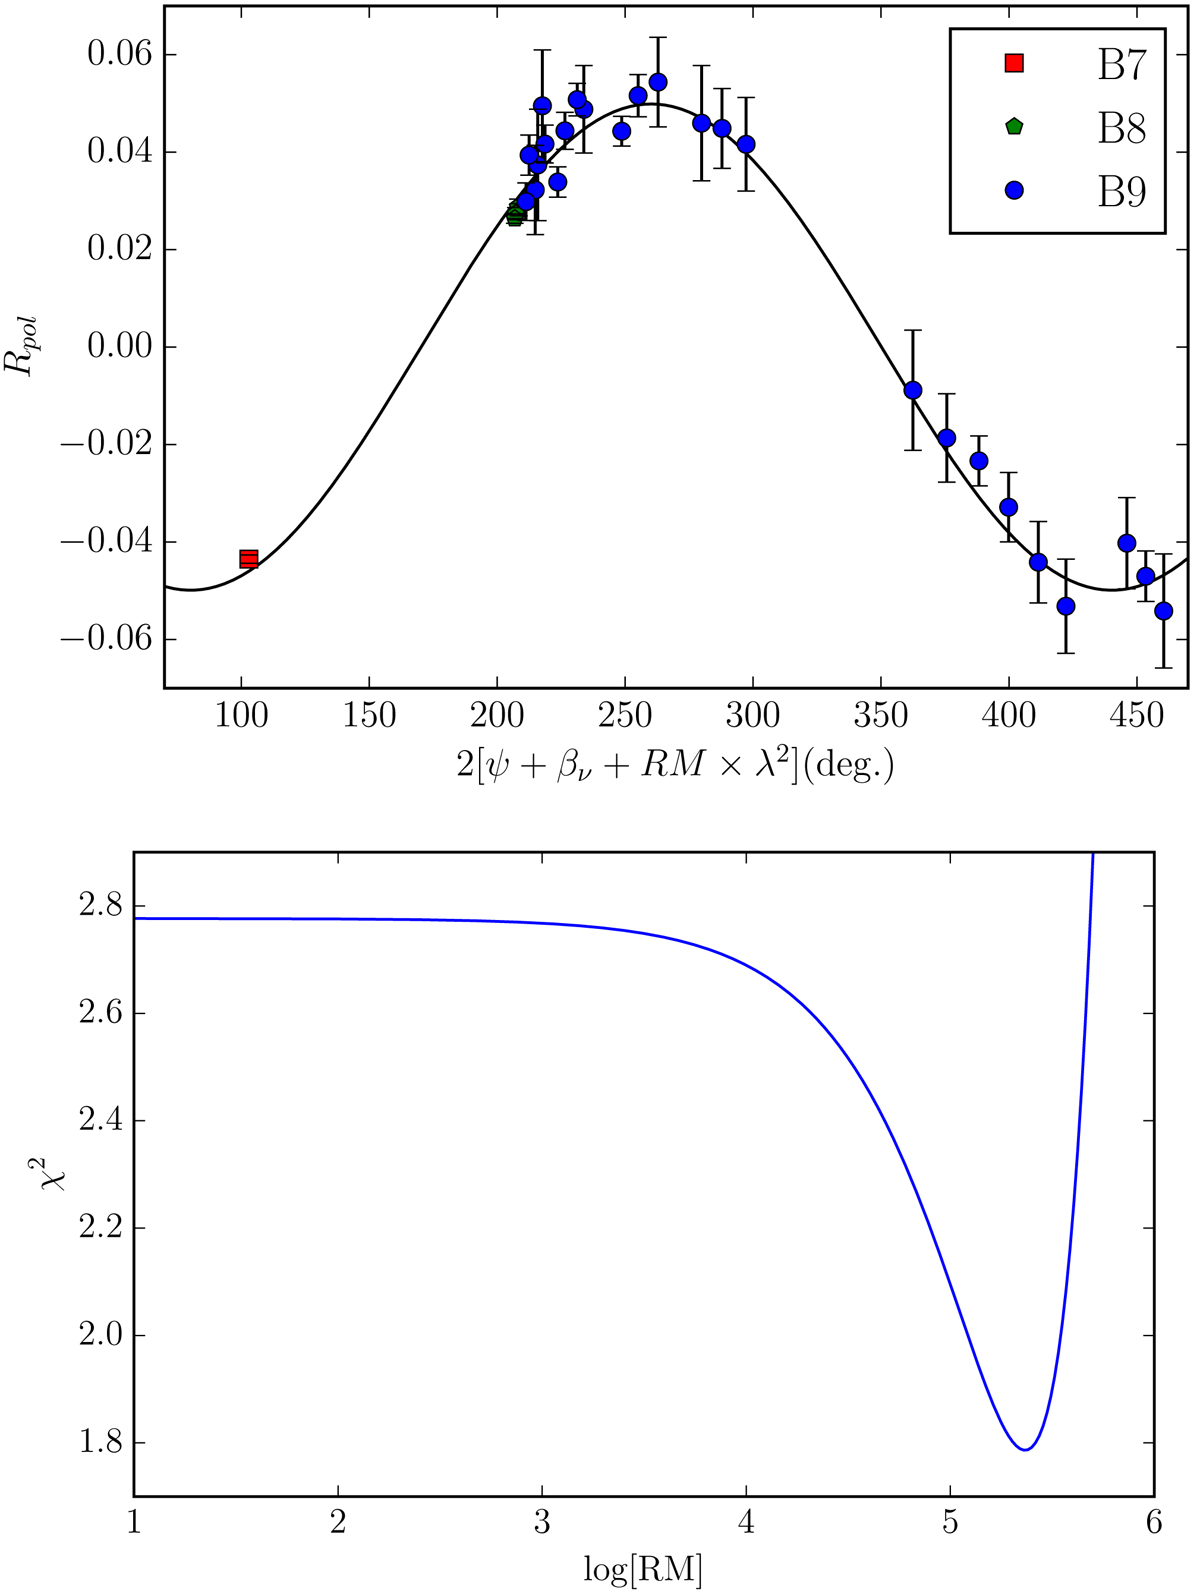
Top panel: data at Bands 7, 8, and 9, observed between May 19 and May 20, together with the best-fit rotation-measure model. Bottom panel: χ 2 as a function of RM (log scale in base 10).
Current usage metrics show cumulative count of Article Views (full-text article views including HTML views, PDF and ePub downloads, according to the available data) and Abstracts Views on Vision4Press platform.
Data correspond to usage on the plateform after 2015. The current usage metrics is available 48-96 hours after online publication and is updated daily on week days.
Initial download of the metrics may take a while.