Free Access
Fig. 4.
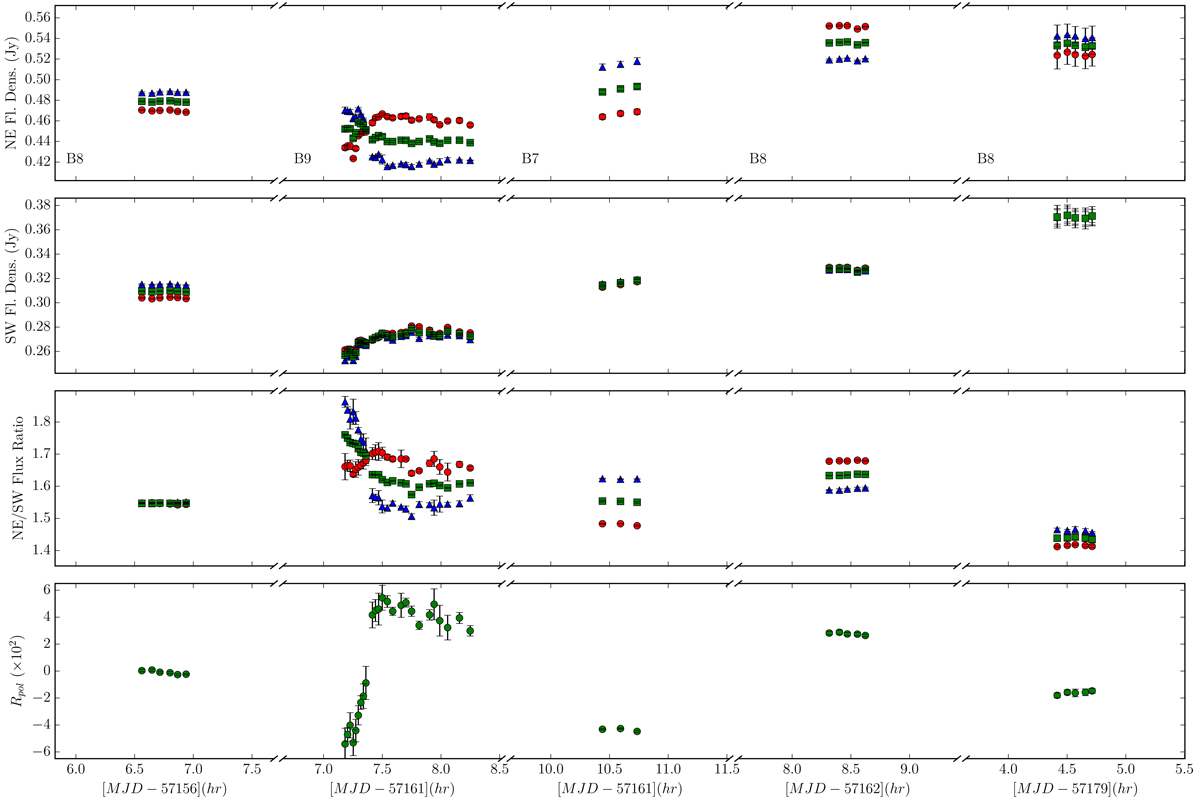
Same quantities as in Fig. 1 for all the ALMA data observed in May-June 2015, but as a function of time and with the flux densities normalized to a common frequency of 650 GHz, assuming a fixed spectral index of α = −1.2 (see Sect. 3.2). The band corresponding to each epoch is shown in the top plots.
Current usage metrics show cumulative count of Article Views (full-text article views including HTML views, PDF and ePub downloads, according to the available data) and Abstracts Views on Vision4Press platform.
Data correspond to usage on the plateform after 2015. The current usage metrics is available 48-96 hours after online publication and is updated daily on week days.
Initial download of the metrics may take a while.