Fig. 1.
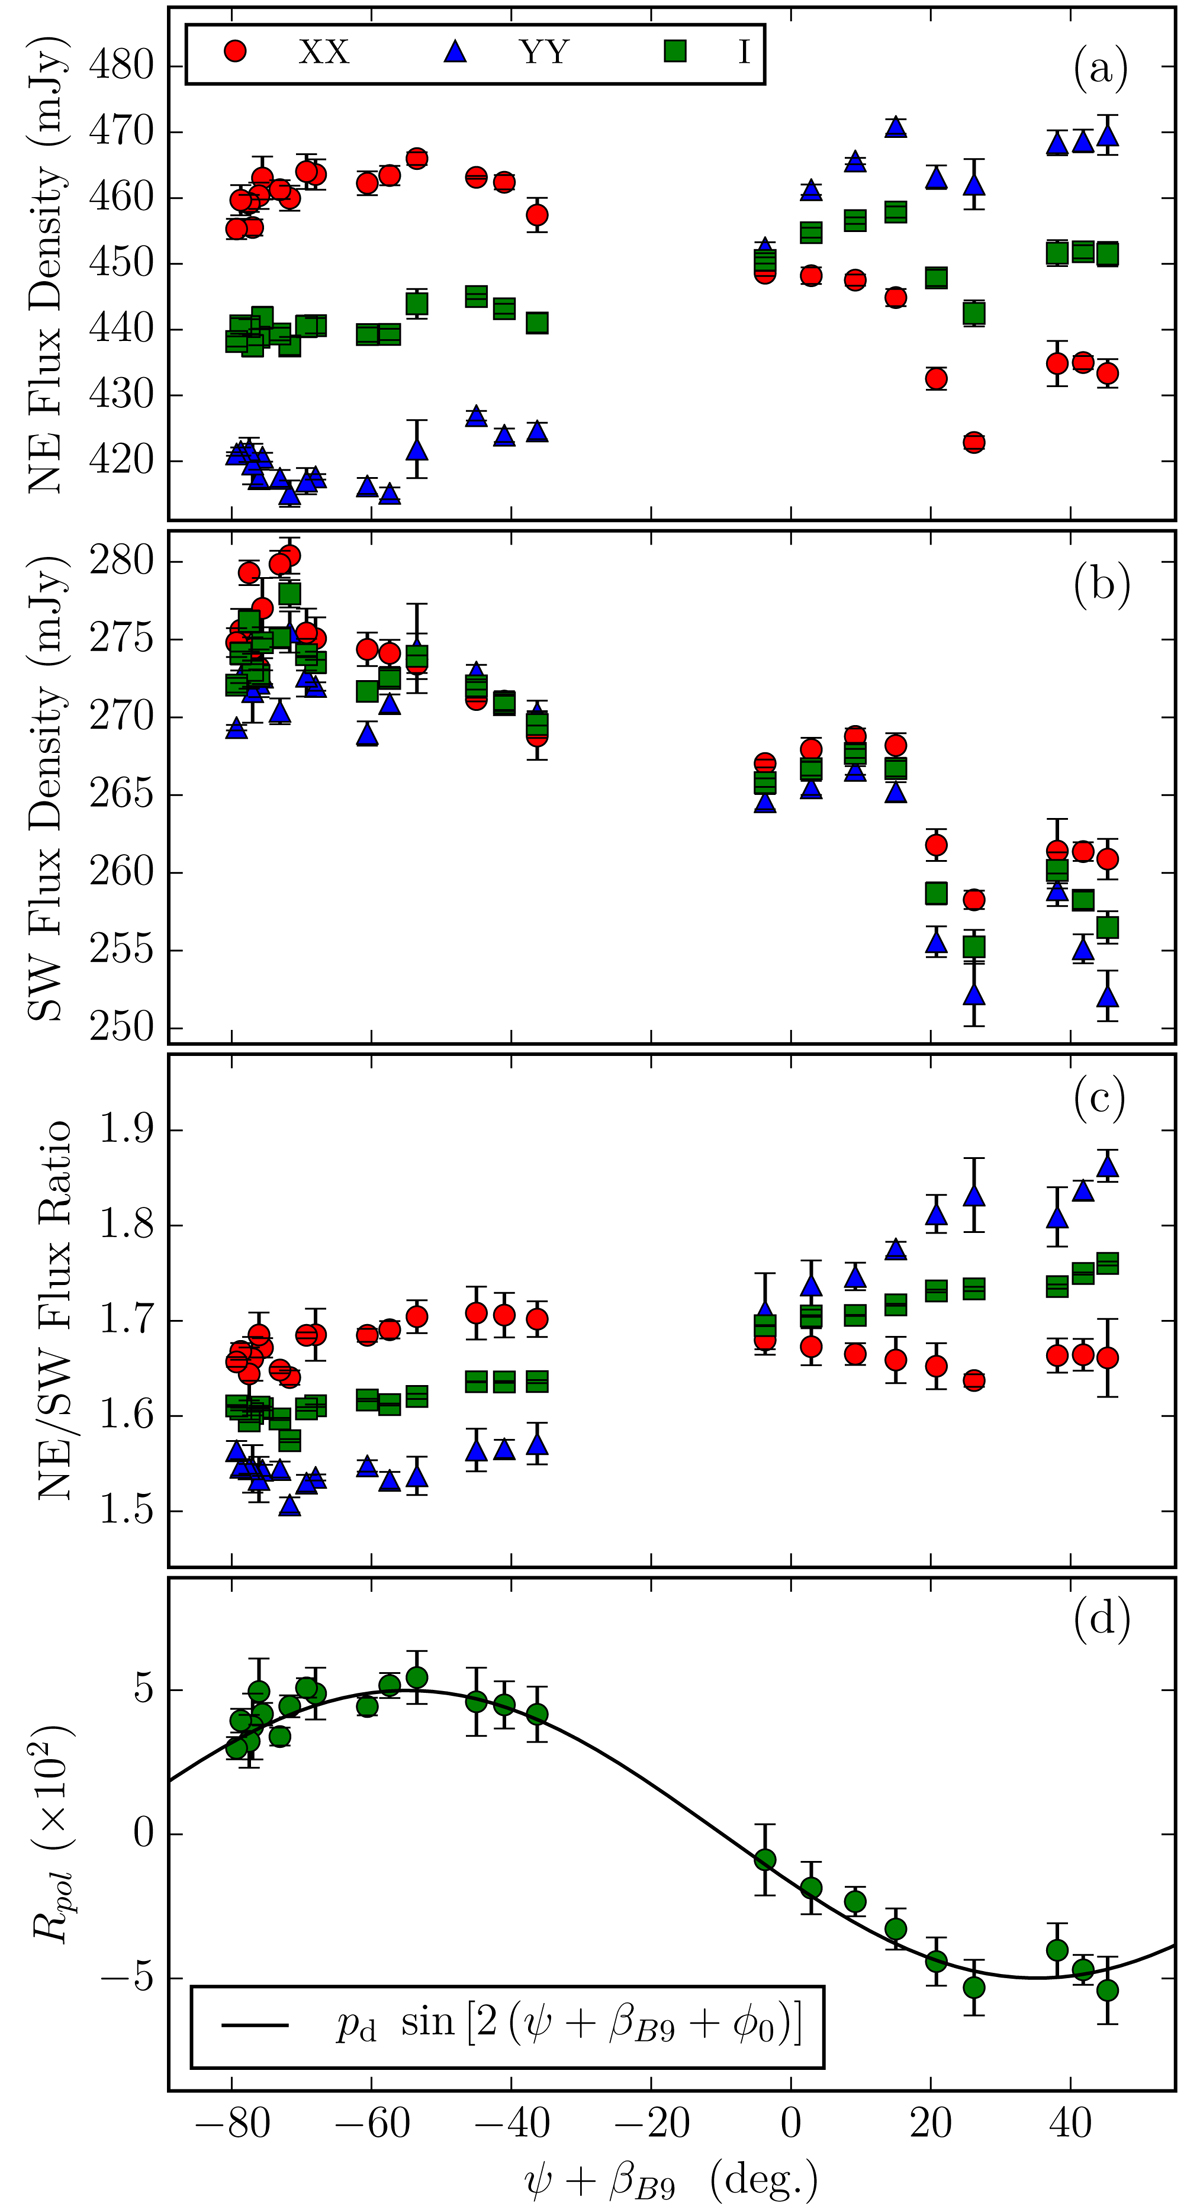
Panel a: flux density of the NE image (in XX and YY polarization products, as well as in Stokes I); panel b: flux density of the SW image (same products as those of NE shown in panel a); panel c: flux-density ratios between NE and SW; panel d polarization ratio, Rpol (see text). All quantities are shown as a function of parallactic angle, ψ, rotated by the feed angle of the Band 9 receivers at ALMA, βB9.
Current usage metrics show cumulative count of Article Views (full-text article views including HTML views, PDF and ePub downloads, according to the available data) and Abstracts Views on Vision4Press platform.
Data correspond to usage on the plateform after 2015. The current usage metrics is available 48-96 hours after online publication and is updated daily on week days.
Initial download of the metrics may take a while.