Free Access
Fig. 9.
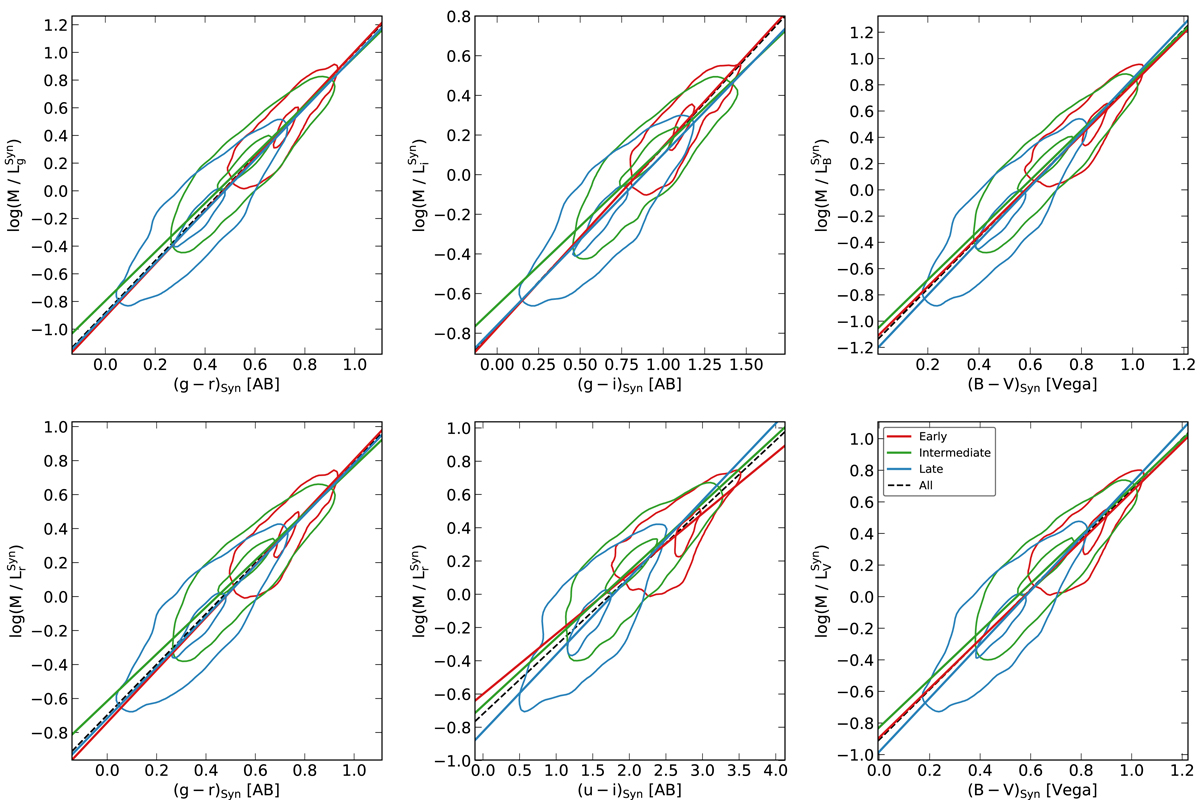
Relation between restframe color and M/L for different bands and for early (red), intermediate (green), and late galaxies (blue). Contours represent the density distribution encompassing 90% and 20% of the points. The dotted black line shows the best fit for all galaxy types.
Current usage metrics show cumulative count of Article Views (full-text article views including HTML views, PDF and ePub downloads, according to the available data) and Abstracts Views on Vision4Press platform.
Data correspond to usage on the plateform after 2015. The current usage metrics is available 48-96 hours after online publication and is updated daily on week days.
Initial download of the metrics may take a while.