Fig. 5.
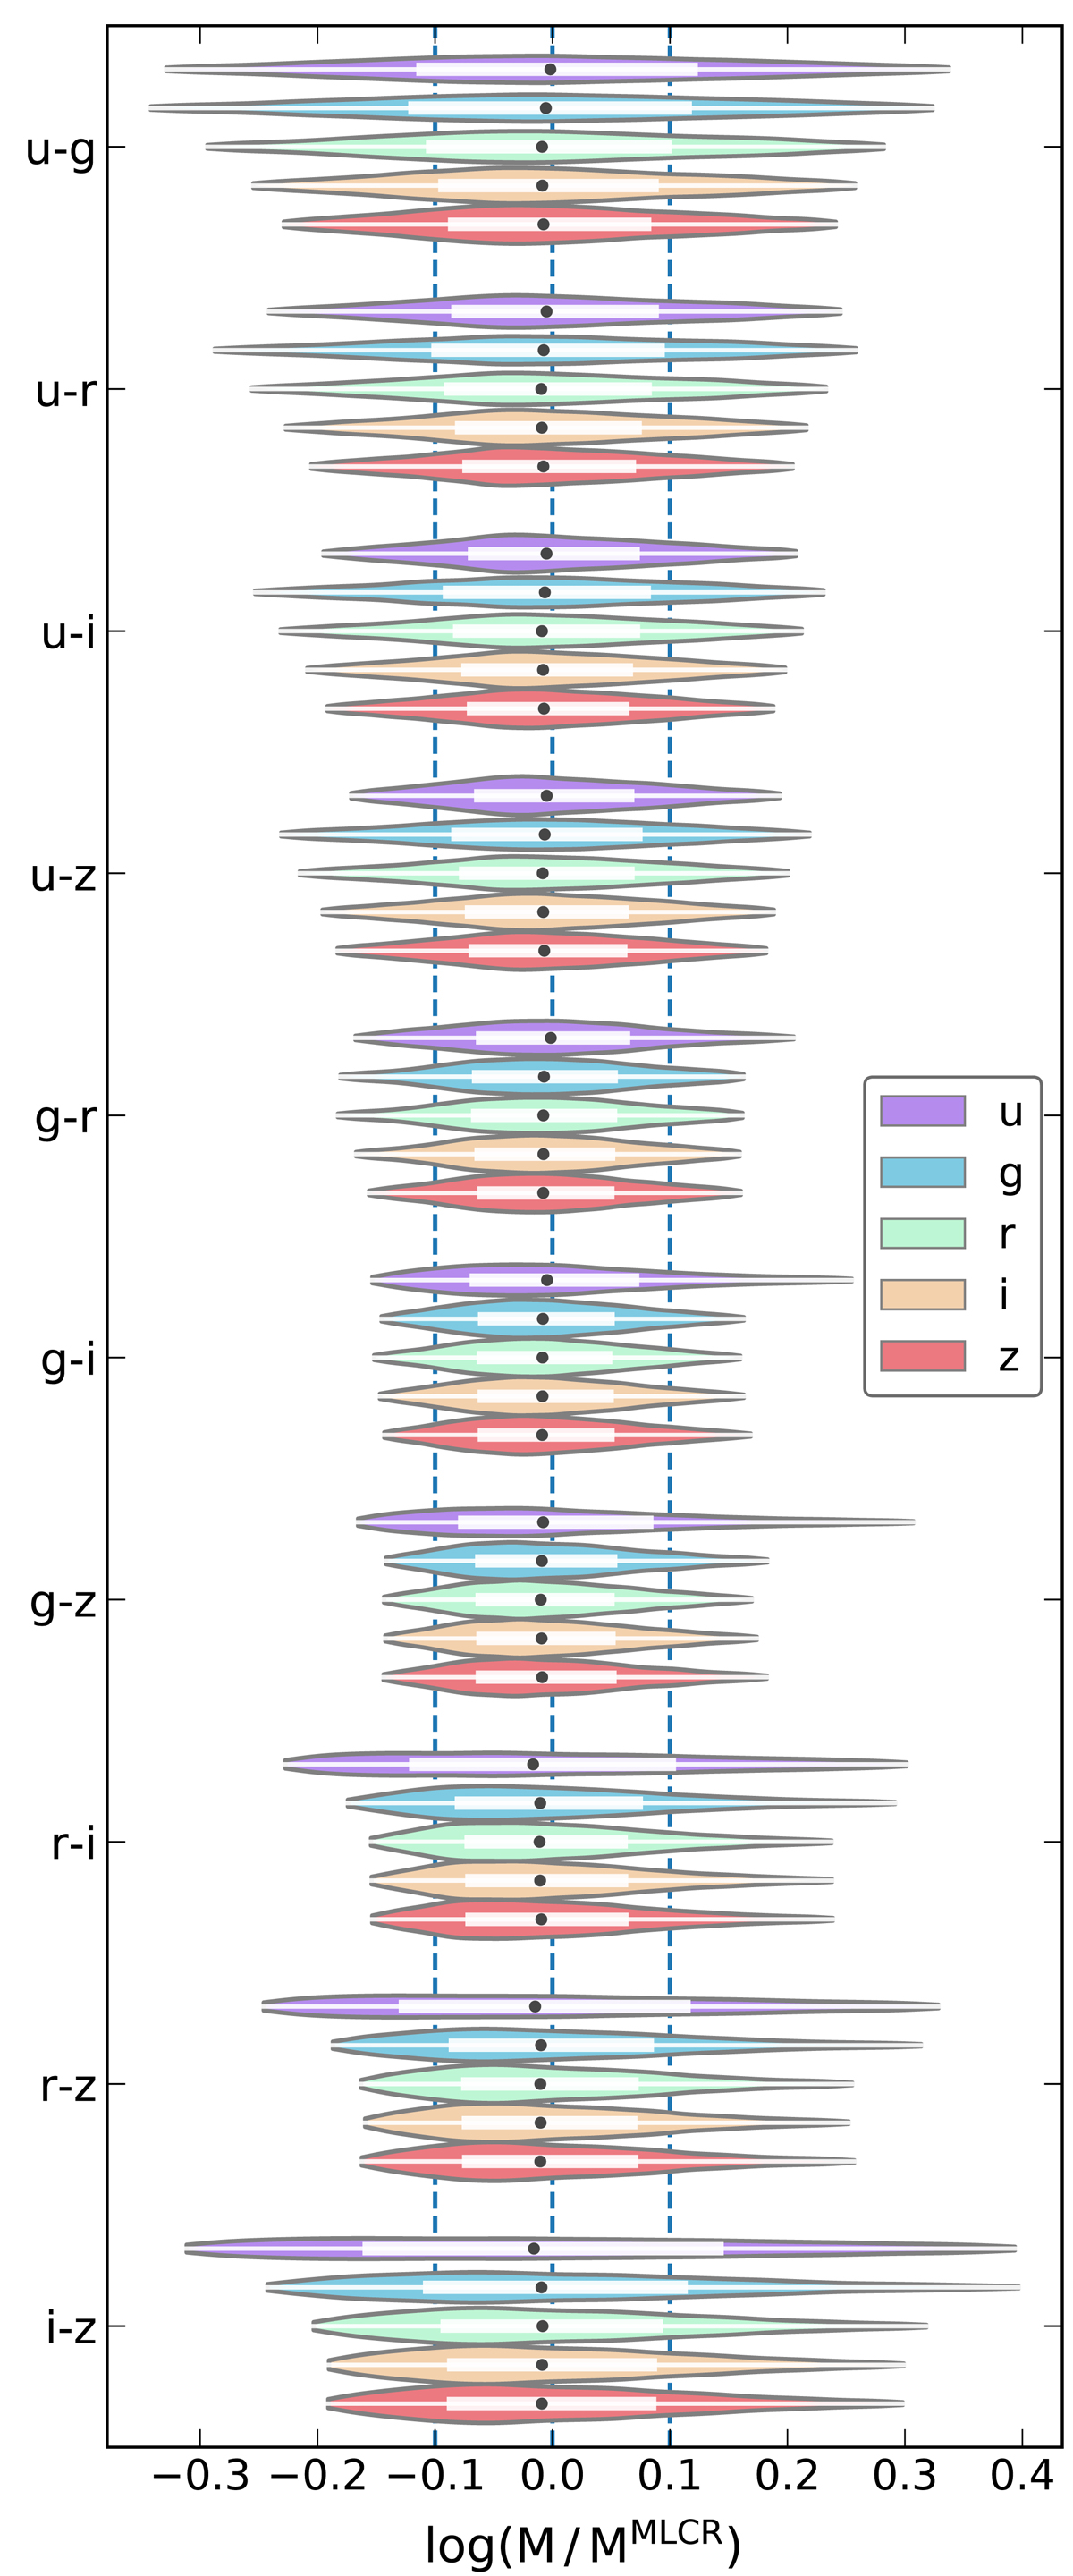
Violin plots of the difference between the spatially resolved mass obtained by applying our MLCRs and the mass derived from the stellar population fitting (Sect. 3.2) for the whole sample and all Sloan filter combinations. The corresponding box plot showing the interquartile range is plotted inside each violin plot. The inner dot in the box plot represents the median of the distribution.
Current usage metrics show cumulative count of Article Views (full-text article views including HTML views, PDF and ePub downloads, according to the available data) and Abstracts Views on Vision4Press platform.
Data correspond to usage on the plateform after 2015. The current usage metrics is available 48-96 hours after online publication and is updated daily on week days.
Initial download of the metrics may take a while.