Free Access
Fig. 3.
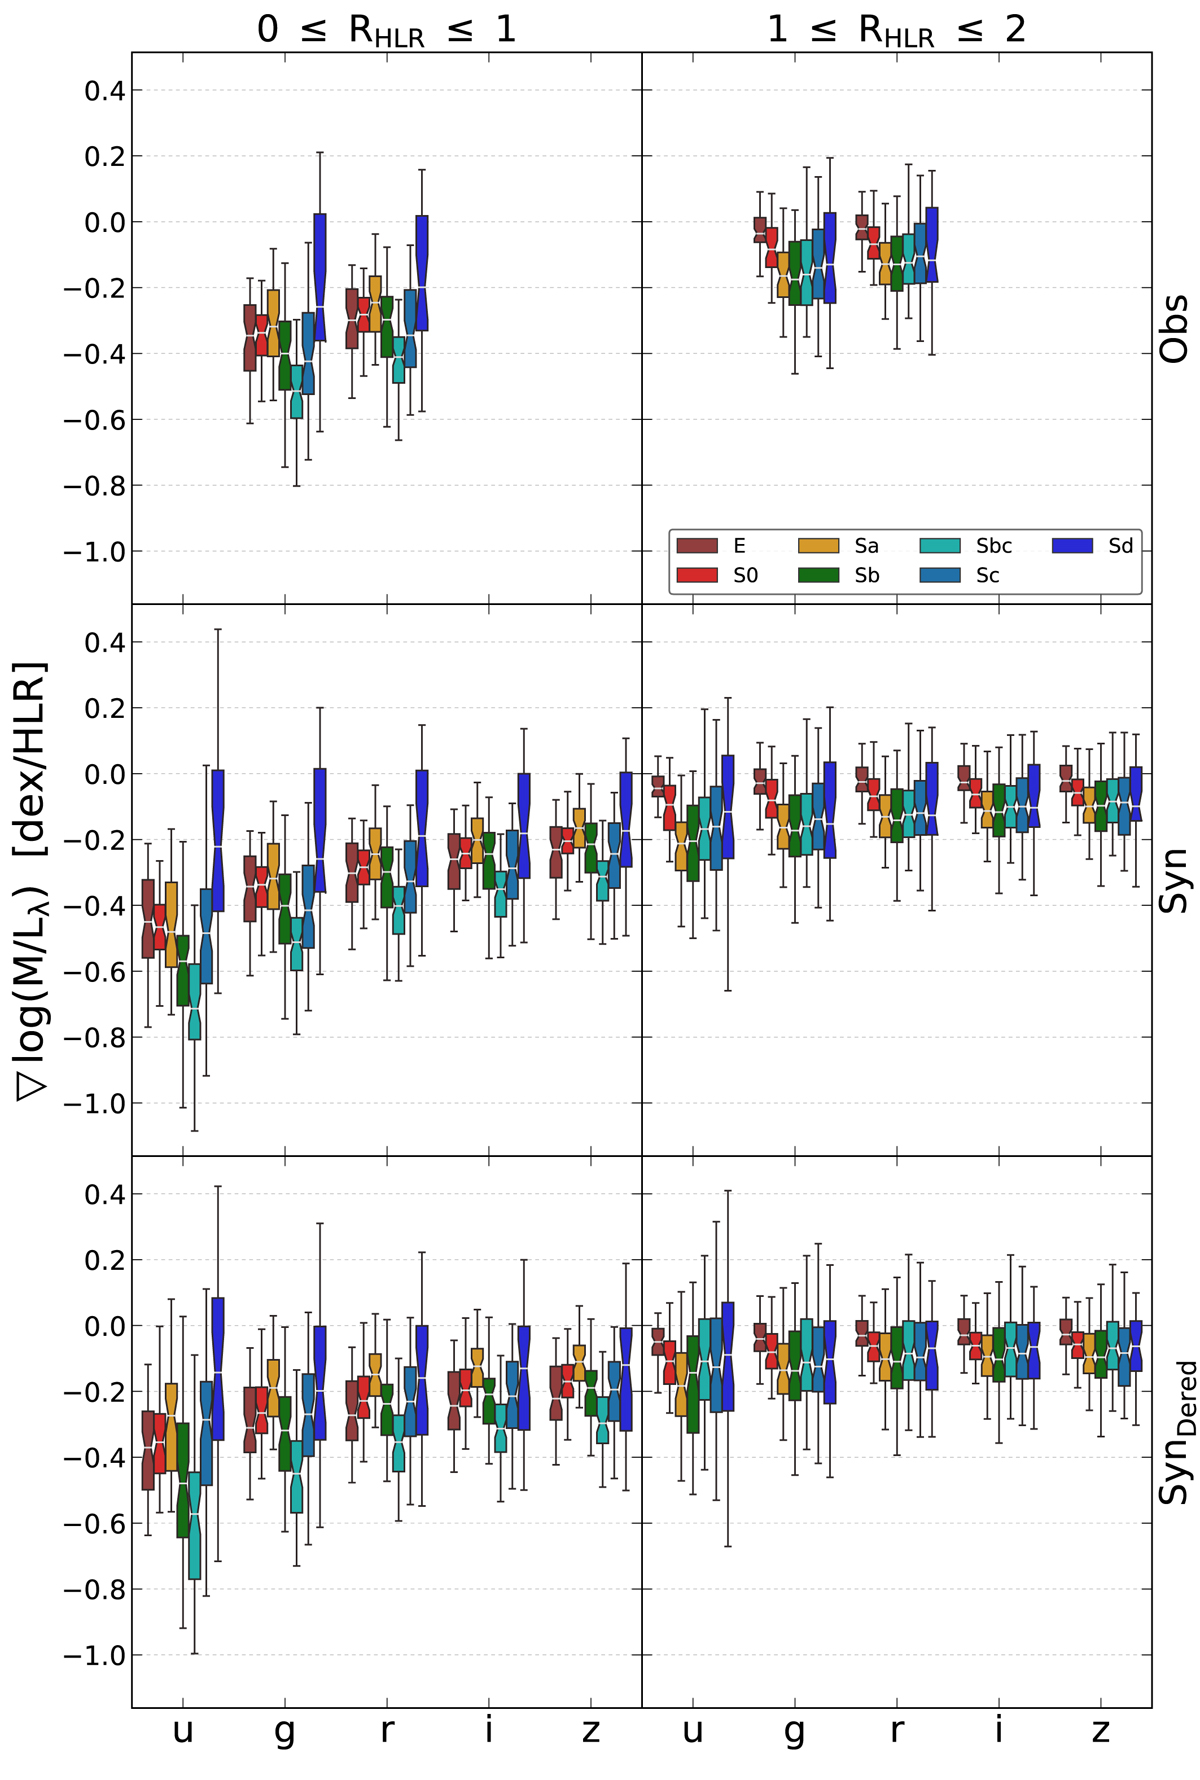
Box plot diagrams of the radial gradients of M/Lλ measured in the inner ▽in (0 ≤ HLR ≤ 1; left panels) and outer ▽out (1 ≤ HLR ≤ 2; right panels) spatial regions in the observed spectra (upper panels; Obs), synthetic spectra (middle panels; Syn), and dereddened synthetic spectra (lower panels; SynDered).
Current usage metrics show cumulative count of Article Views (full-text article views including HTML views, PDF and ePub downloads, according to the available data) and Abstracts Views on Vision4Press platform.
Data correspond to usage on the plateform after 2015. The current usage metrics is available 48-96 hours after online publication and is updated daily on week days.
Initial download of the metrics may take a while.