Fig. 2.
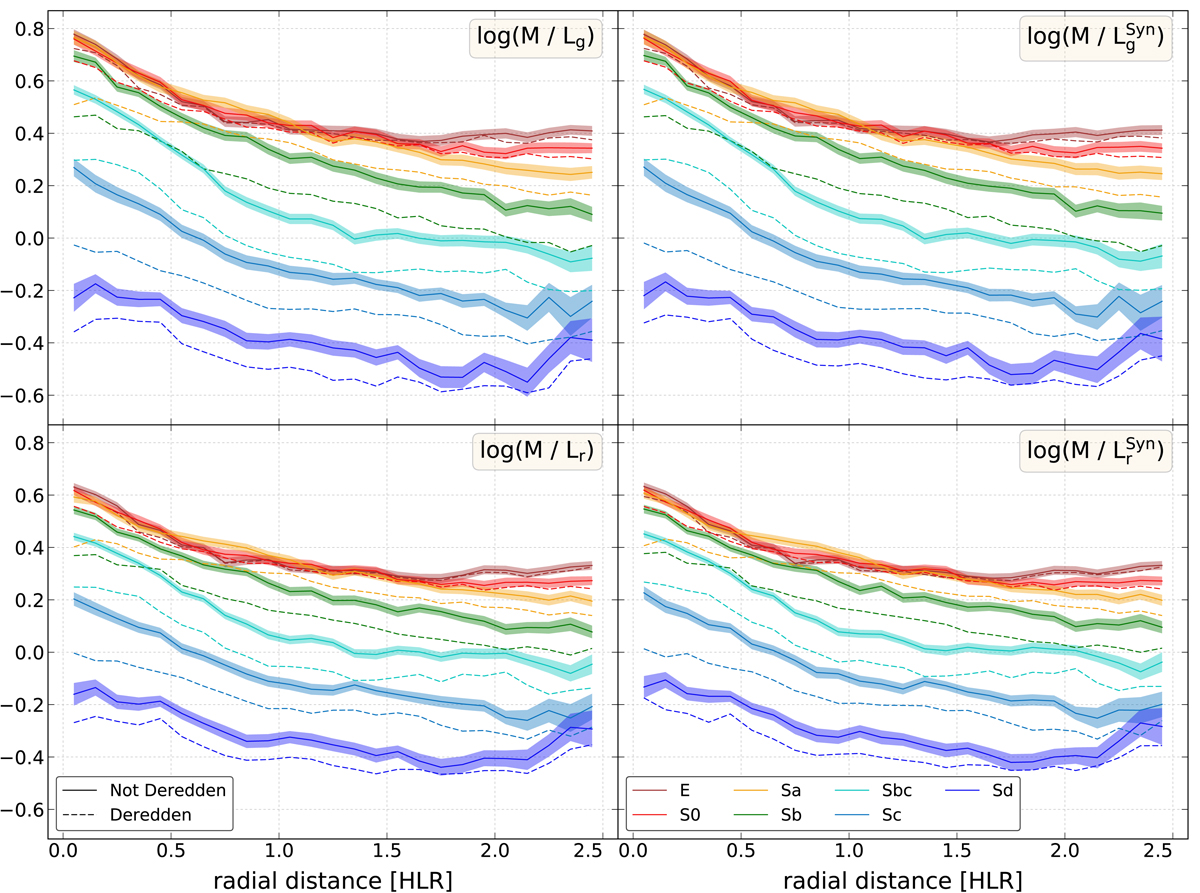
Radial profile of M/L for g (upper panels) and r band (lower panels) stacked by Hubble type for the observed (left panels) and synthetic restframe spectra (right panels). The profiles with intrinsic extinction are shown in continuous lines and the deredden profiles (using the extinction values given by the stellar population analysis) in dashed lines. For the sake of clarity, the uncertainty band is plotted only in the not dereddened profiles.
Current usage metrics show cumulative count of Article Views (full-text article views including HTML views, PDF and ePub downloads, according to the available data) and Abstracts Views on Vision4Press platform.
Data correspond to usage on the plateform after 2015. The current usage metrics is available 48-96 hours after online publication and is updated daily on week days.
Initial download of the metrics may take a while.