Open Access
Fig. 9.
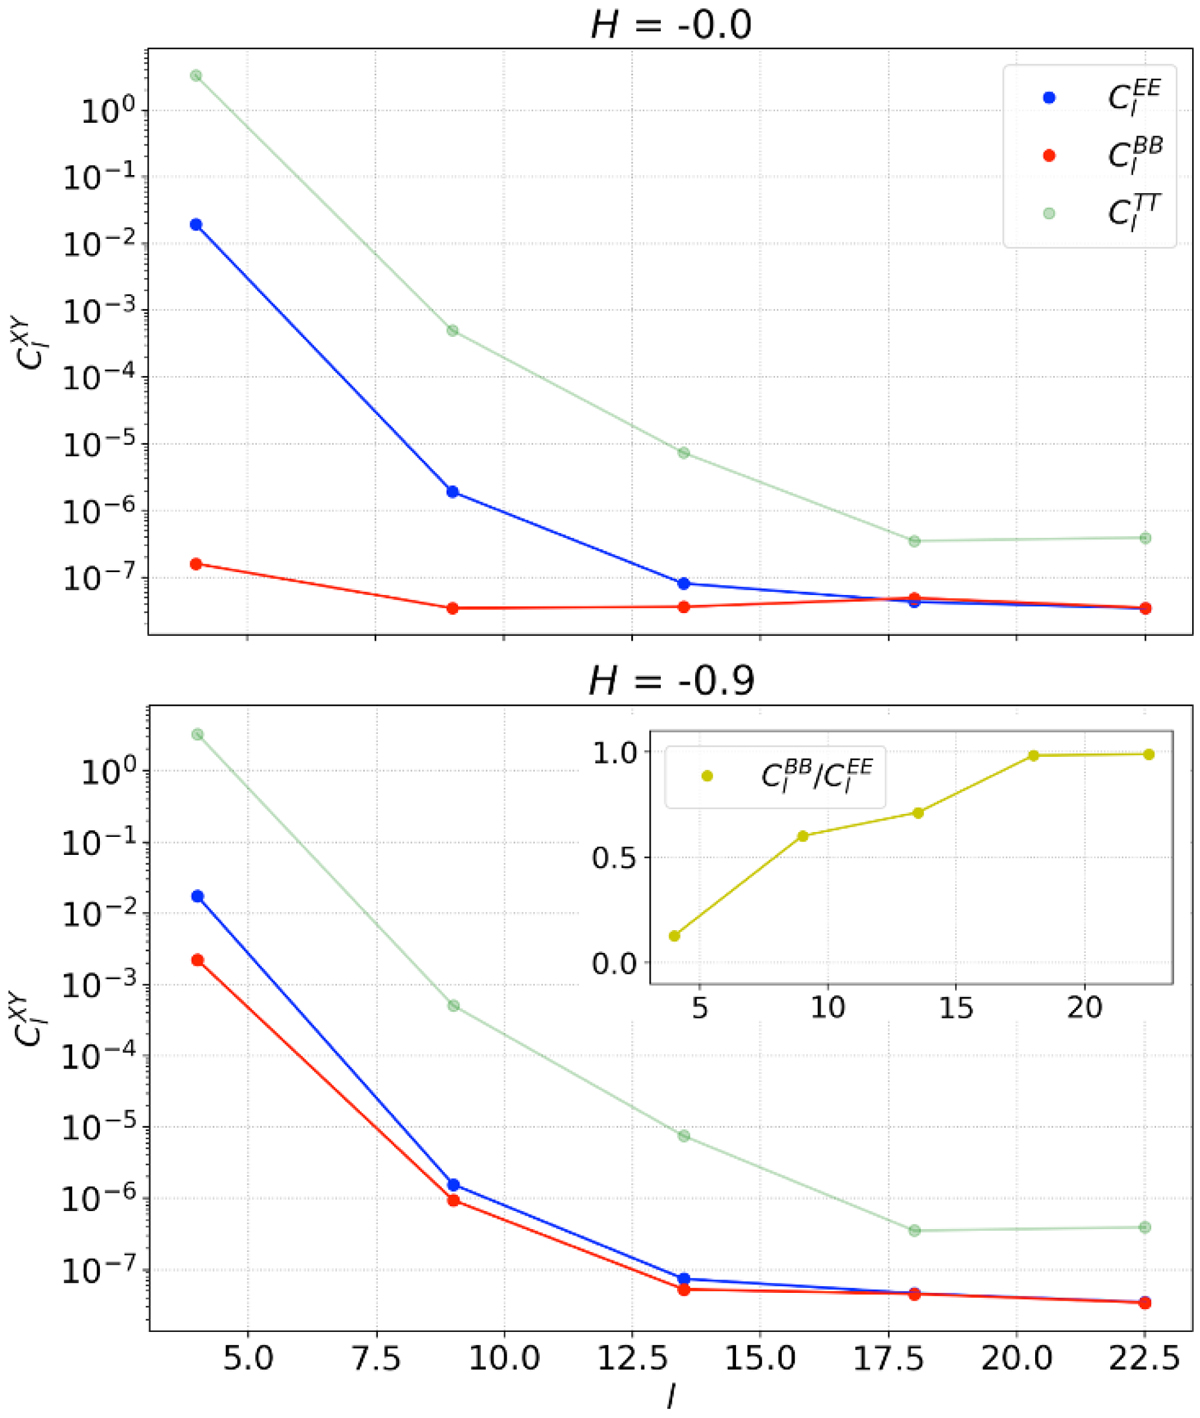
Polarization power spectra for αb = 0 (top panel) and αb = −20% (bottom panel). As shown by the model with αb = −20%, the relative power between B and E modes is not constant; see the ratio in yellow in the sub-plot in the bottom panel.
Current usage metrics show cumulative count of Article Views (full-text article views including HTML views, PDF and ePub downloads, according to the available data) and Abstracts Views on Vision4Press platform.
Data correspond to usage on the plateform after 2015. The current usage metrics is available 48-96 hours after online publication and is updated daily on week days.
Initial download of the metrics may take a while.