Fig. 7.
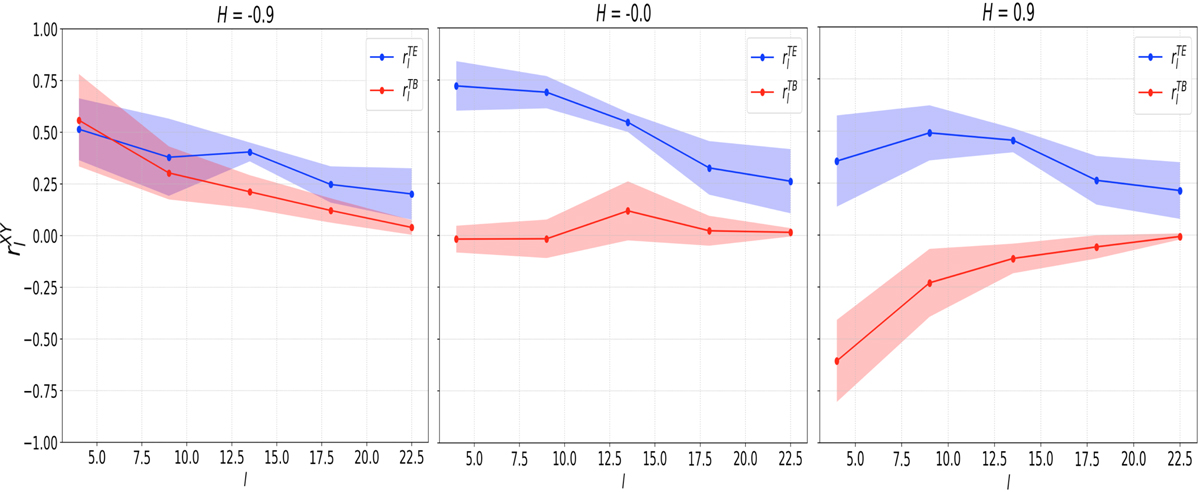
Mean values of the parameters ![]() , with X = T and Y = E, B (blue and red, respectively) in bins of the multipole l (with 1 − σ errors in colored shades) for the model in which the observer is located within the helical structure of the magnetic field. The diagrams change from left to right for models with αb = −20%, 0%, and +20%. A weak left-handed helical magnetic field would produce positive T–B and T–E correlations.
, with X = T and Y = E, B (blue and red, respectively) in bins of the multipole l (with 1 − σ errors in colored shades) for the model in which the observer is located within the helical structure of the magnetic field. The diagrams change from left to right for models with αb = −20%, 0%, and +20%. A weak left-handed helical magnetic field would produce positive T–B and T–E correlations.
Current usage metrics show cumulative count of Article Views (full-text article views including HTML views, PDF and ePub downloads, according to the available data) and Abstracts Views on Vision4Press platform.
Data correspond to usage on the plateform after 2015. The current usage metrics is available 48-96 hours after online publication and is updated daily on week days.
Initial download of the metrics may take a while.