Fig. 2.
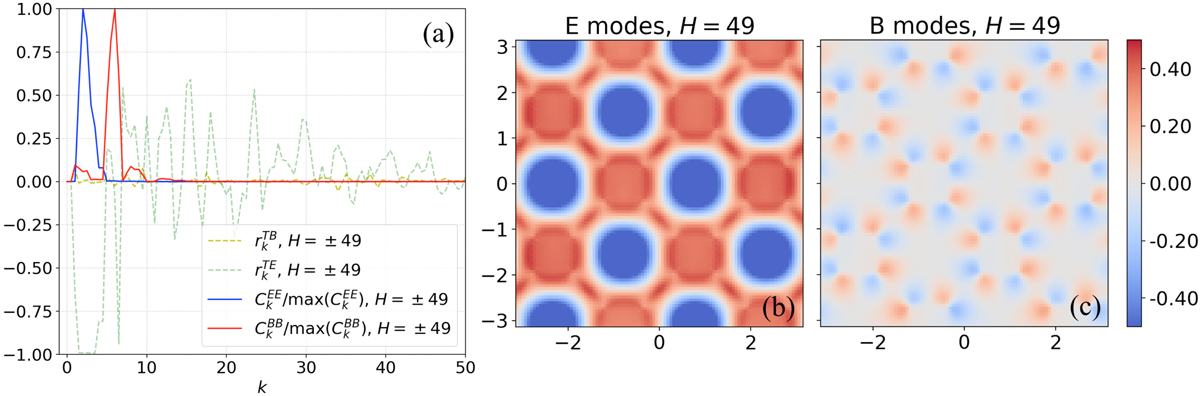
E and B modes for the case of 𝒜ℬ𝒞 field illustrated in Fig. 1. Panel a: normalized autocorrelation power spectra of E and B modes, where max![]() /max
/max![]() , and the parameters
, and the parameters ![]() and
and ![]() (see Eq. (9)). These functions attain the exact same value independently of the sign of the total helicity, H. Panels b and c: maps of E and B modes with LOS integration along the y-axis.
(see Eq. (9)). These functions attain the exact same value independently of the sign of the total helicity, H. Panels b and c: maps of E and B modes with LOS integration along the y-axis.
Current usage metrics show cumulative count of Article Views (full-text article views including HTML views, PDF and ePub downloads, according to the available data) and Abstracts Views on Vision4Press platform.
Data correspond to usage on the plateform after 2015. The current usage metrics is available 48-96 hours after online publication and is updated daily on week days.
Initial download of the metrics may take a while.