Table 1.
Designed 50-layer CNN, based on the ResNet architecture.
| Layer | Output |
Operation | |
|---|---|---|---|
| Size | Channels | ||
| input | 80×80 | 3 | |
| conv1 | 80×80 | 64 | 7×7 |
| max_pool | 40×40 | 64 | 3×3 max pool/2 |
| conv2_x | 40×40 | 128 |
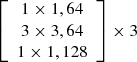 |
| conv3_x | 20×20 | 256 |
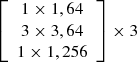 |
| conv4_x | 10×10 | 512 |
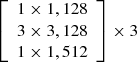 |
| conv5_x | 5×5 | 1024 |
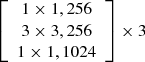 |
| avg_pool | 1×1 | 1024 | global average pool |
| fc1024 | 1×1 | 1024 | fully connected |
| output | 1×1 | 3 | linear |
Notes. The layers of the network are listed top to bottom, starting from the images of clusters and with the final layer producing the age, mass, and size of the cluster. The convolutional layers are actually groups of blocks depicted in Fig. 2, with the “_x” in the name acting as a placeholder for the block number. The size of the outputs of each layer, both in spatial dimensions and in channel count, are listed on the second and third columns. The last column lists the operations that each layer performs. The layers or blocks with a stride of 2 are: max_pool, conv3_1, conv4_1, and conv5_1; as can be seen when input and output sizes differ by 2.
Current usage metrics show cumulative count of Article Views (full-text article views including HTML views, PDF and ePub downloads, according to the available data) and Abstracts Views on Vision4Press platform.
Data correspond to usage on the plateform after 2015. The current usage metrics is available 48-96 hours after online publication and is updated daily on week days.
Initial download of the metrics may take a while.