Free Access
Fig. 8.
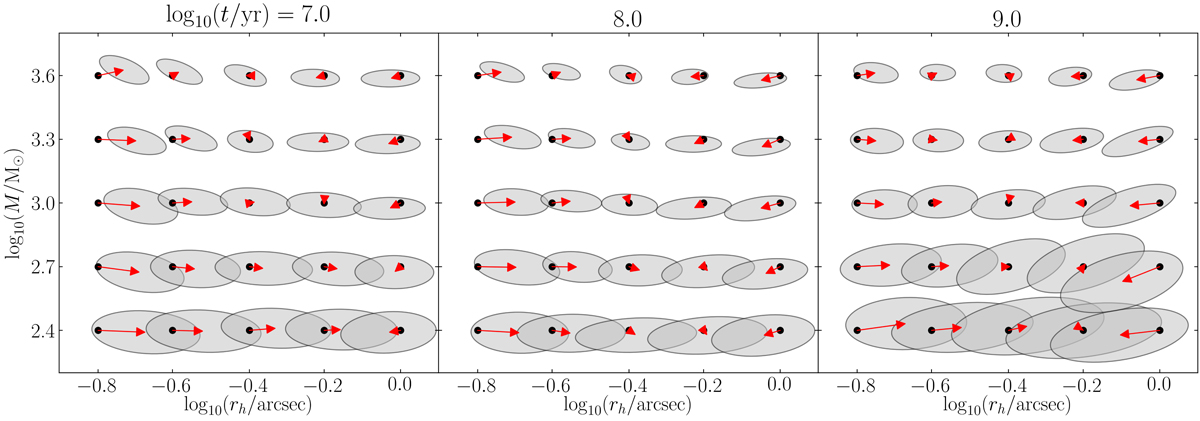
Test results of CNN performance. Each black dot corresponds to the true parameters of 200 artificial clusters. The gray ellipses enclose one σ of the inferred values (accuracy), with the red arrows pointing to the means of the distributions (biases). The panels show mass vs. rh for three different ages.
Current usage metrics show cumulative count of Article Views (full-text article views including HTML views, PDF and ePub downloads, according to the available data) and Abstracts Views on Vision4Press platform.
Data correspond to usage on the plateform after 2015. The current usage metrics is available 48-96 hours after online publication and is updated daily on week days.
Initial download of the metrics may take a while.