Fig. 7.
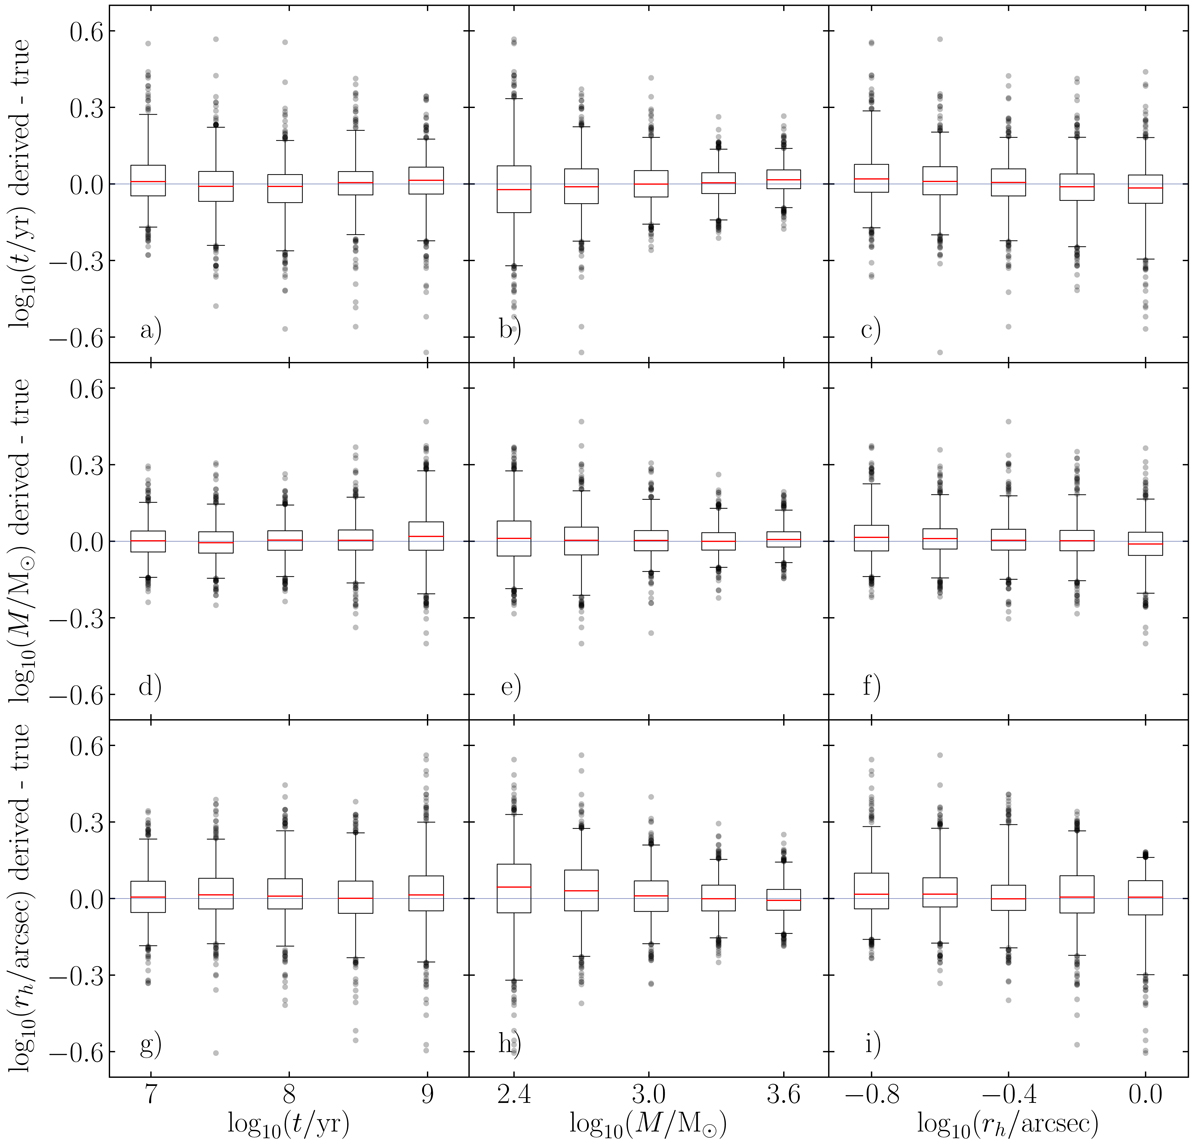
Differences between CNN-derived and true parameters, plotted against true parameter (age, mass, and size) values of artificial clusters. The true ages and true masses are put into bins of 0.5 and 0.3 dex in width, respectively. The rh bins correspond to EFF model parameters indicated by dots on the constant rh values in Fig. 5. The widths of the boxes for age and mass correspond to half the widths of the bins. The spread of the parameter differences are displayed as box plots. The line in the middle of each box is the median error. Boxes extend from the first to the third quartiles. The whiskers denote the range between the 2th and 98th percentiles. Anything above and below the whiskers is plotted as separate points.
Current usage metrics show cumulative count of Article Views (full-text article views including HTML views, PDF and ePub downloads, according to the available data) and Abstracts Views on Vision4Press platform.
Data correspond to usage on the plateform after 2015. The current usage metrics is available 48-96 hours after online publication and is updated daily on week days.
Initial download of the metrics may take a while.