Fig. 6.
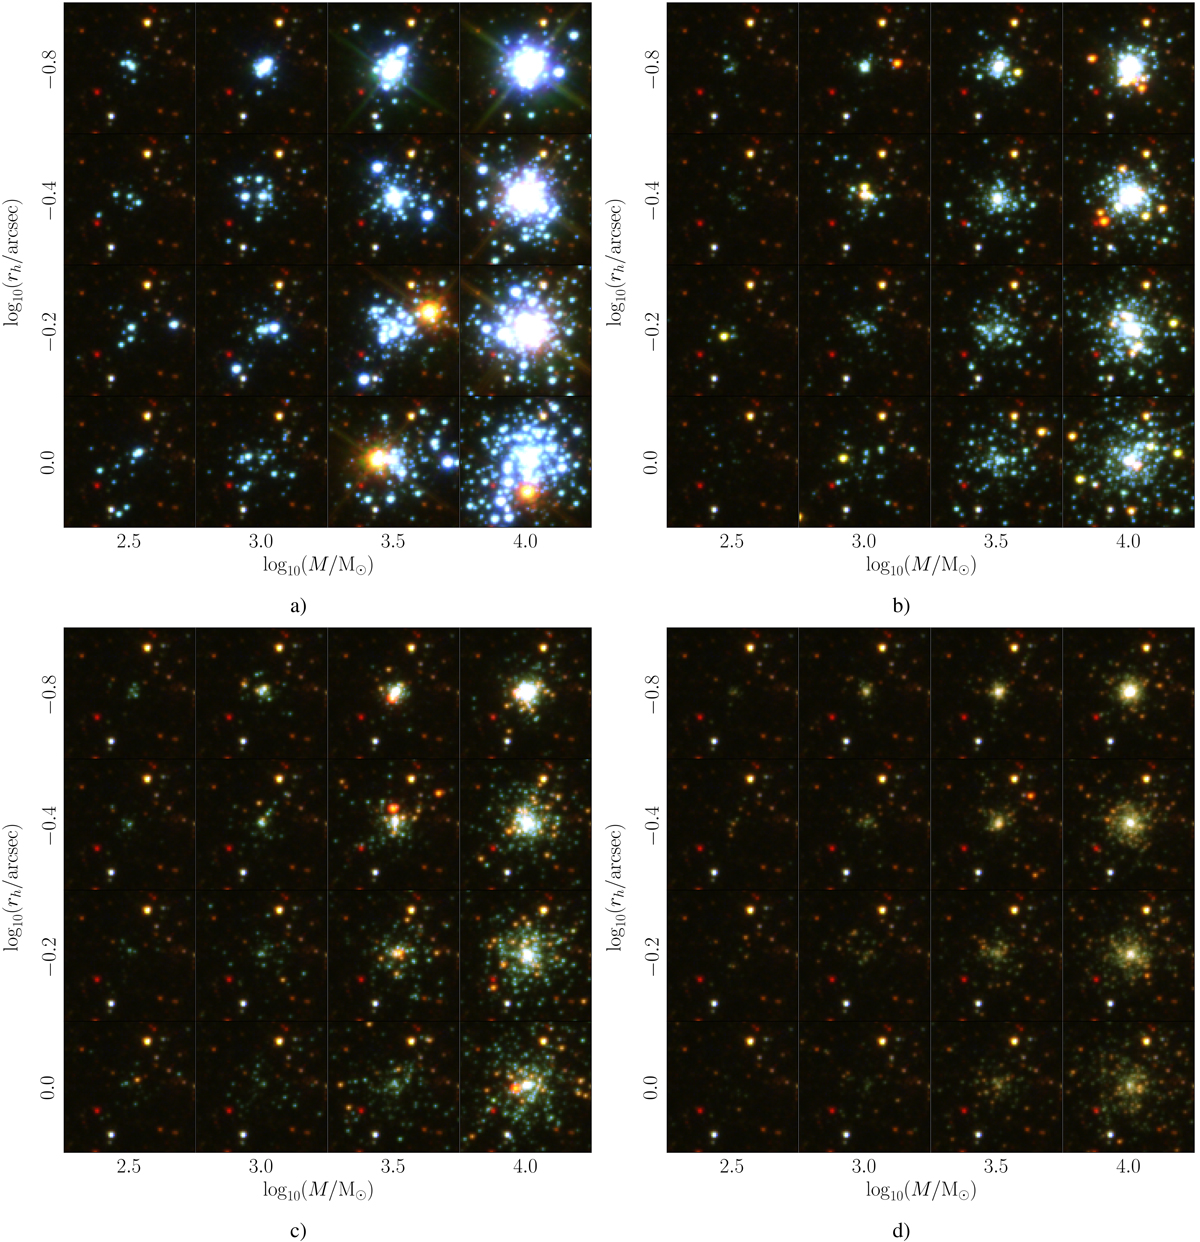
Examples of generated clusters on a real background image. The ages of all of the displayed clusters are: log(t/yr)=7.0 (panel a), 8.0 (panel b), 8.5 (panel c), 9.0 (panel d). The masses and rh values are varied as shown on the axes. The intensity scale of the images was normalized with the arcsinh function. The background is the same for all of the displayed clusters for clarity.
Current usage metrics show cumulative count of Article Views (full-text article views including HTML views, PDF and ePub downloads, according to the available data) and Abstracts Views on Vision4Press platform.
Data correspond to usage on the plateform after 2015. The current usage metrics is available 48-96 hours after online publication and is updated daily on week days.
Initial download of the metrics may take a while.