Fig. 3.
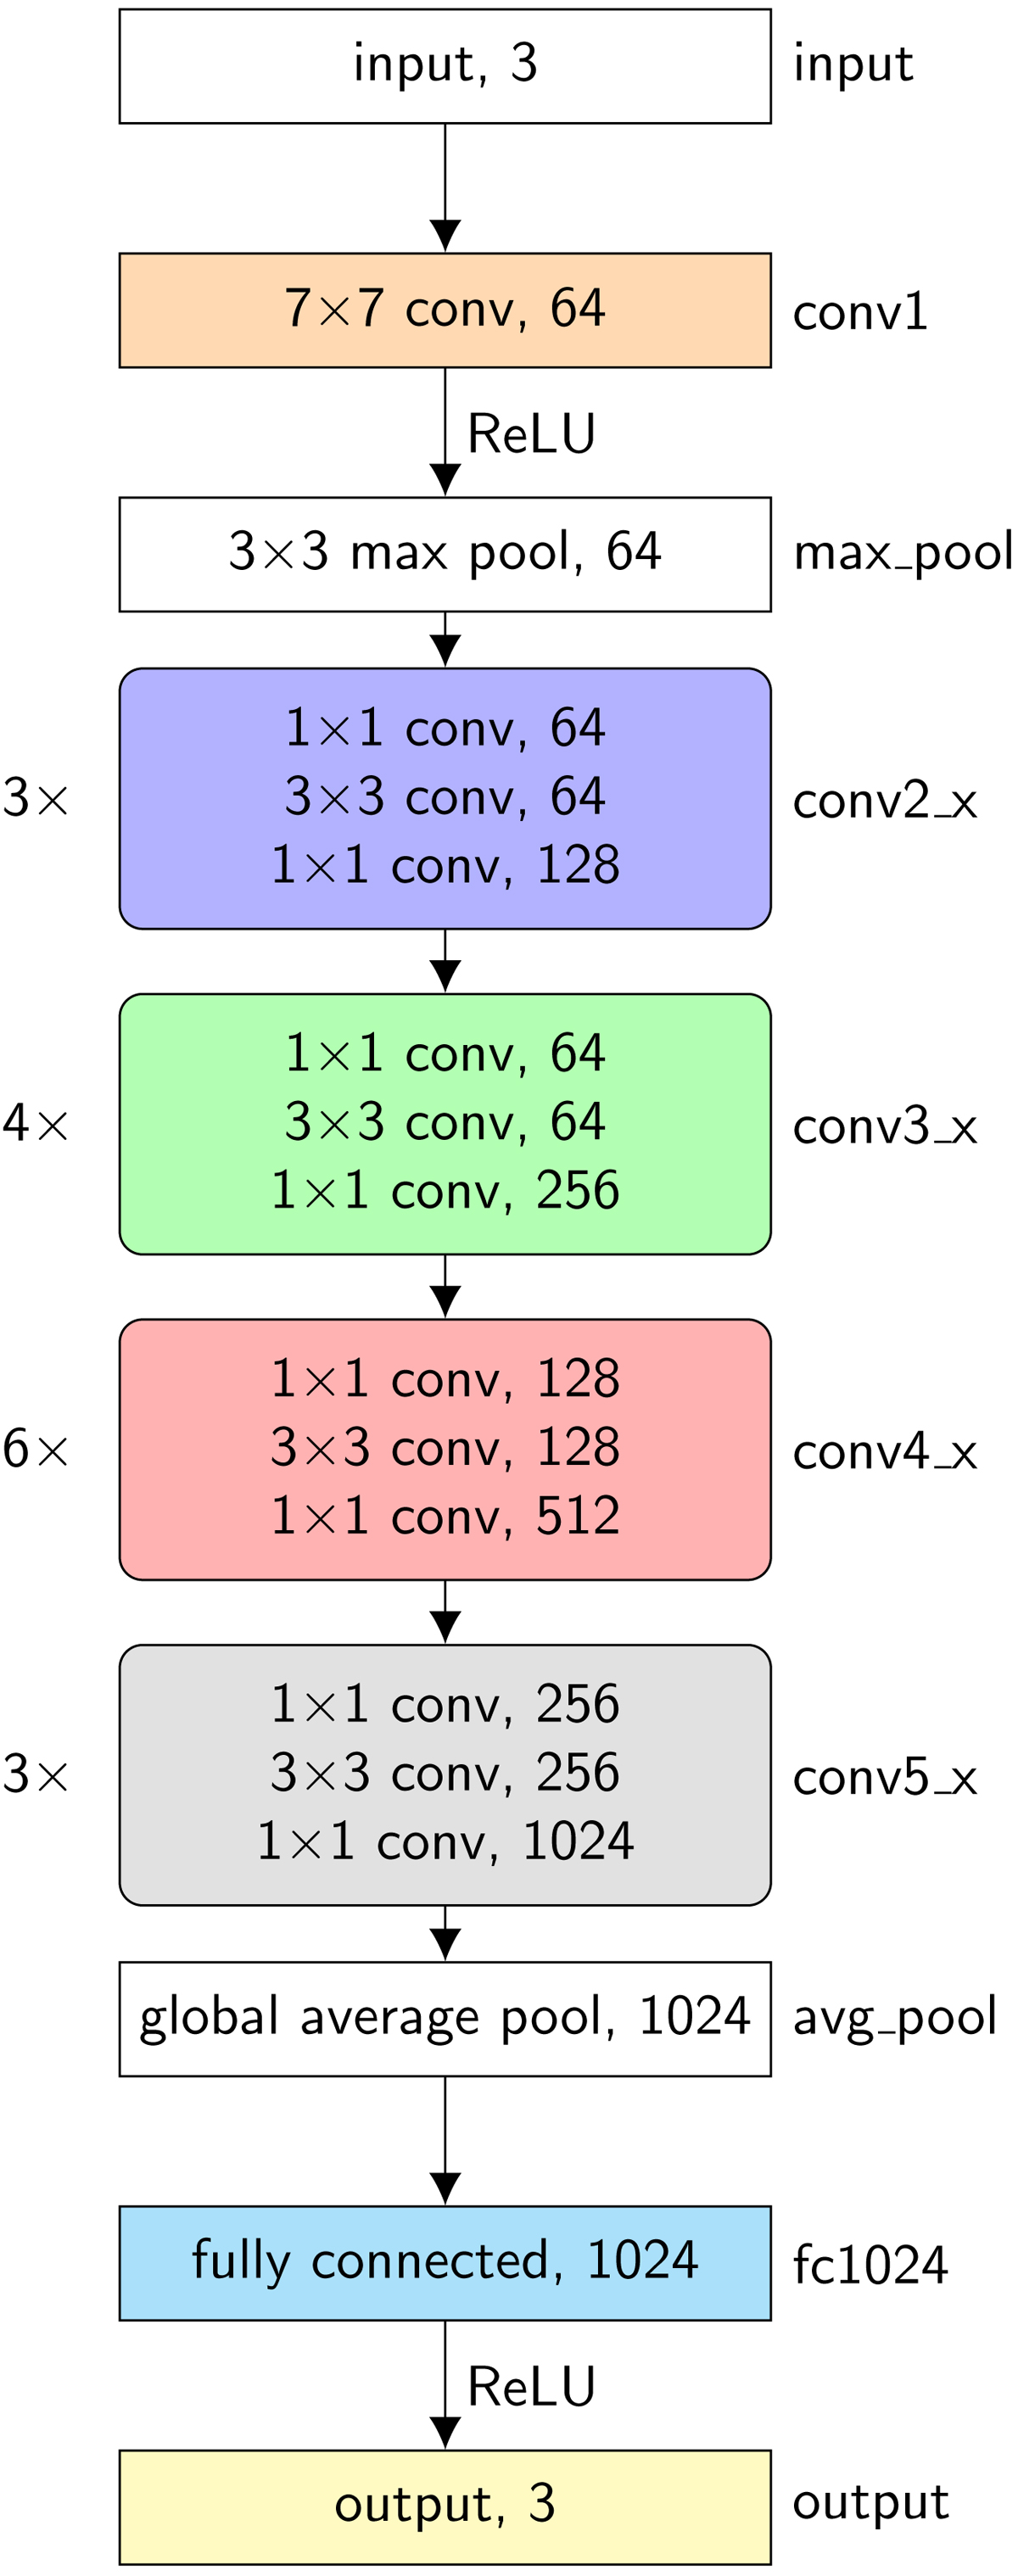
A block diagram of the used CNN. The input image of a cluster passes through the network top to bottom, with the output result being age, mass, and size. All blocks with sharp corners depict singular layers, while blocks with rounded corners are groupings of layers (see example in Fig. 2), with the number on the left indicating how many times the group is repeated sequentially and the name on the right corresponding to the layer names in Table 1. The blocks in color are parts of the network with optimizable parameters. The last number in each row is the number of output channels from that layer.
Current usage metrics show cumulative count of Article Views (full-text article views including HTML views, PDF and ePub downloads, according to the available data) and Abstracts Views on Vision4Press platform.
Data correspond to usage on the plateform after 2015. The current usage metrics is available 48-96 hours after online publication and is updated daily on week days.
Initial download of the metrics may take a while.