Fig. 1.
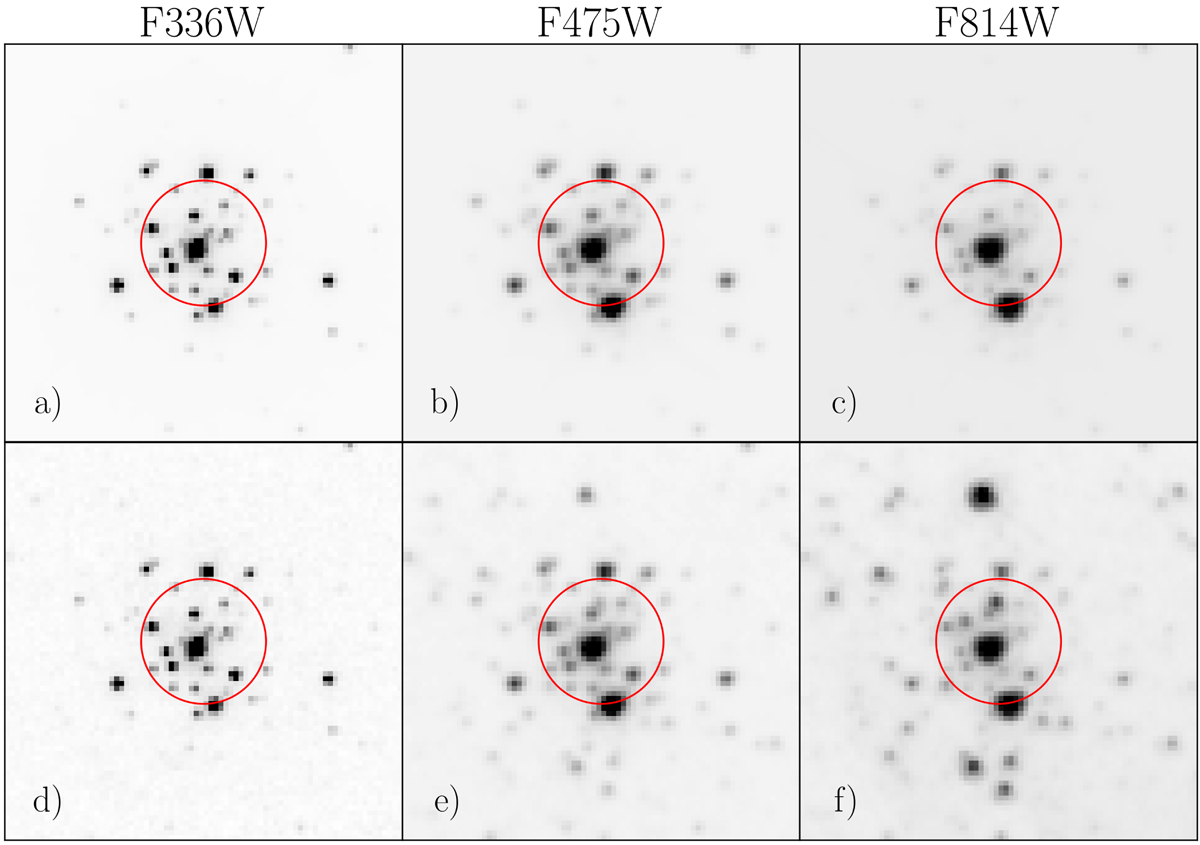
An example of a mock cluster drawn with GalSim, without (top panels) and with a random background from PHAT (bottom panels). Passbands are indicated at the top of each panel. A cluster with typical parameters of log10(t/yr)=8.0, log10(M/M⊙)=3.0, and rh = 0.6 arcsec is shown. The red circle of rh radius encloses half of the stars of each cluster. The intensity of the images is normalized with the arcsinh function.
Current usage metrics show cumulative count of Article Views (full-text article views including HTML views, PDF and ePub downloads, according to the available data) and Abstracts Views on Vision4Press platform.
Data correspond to usage on the plateform after 2015. The current usage metrics is available 48-96 hours after online publication and is updated daily on week days.
Initial download of the metrics may take a while.