Fig. 7.
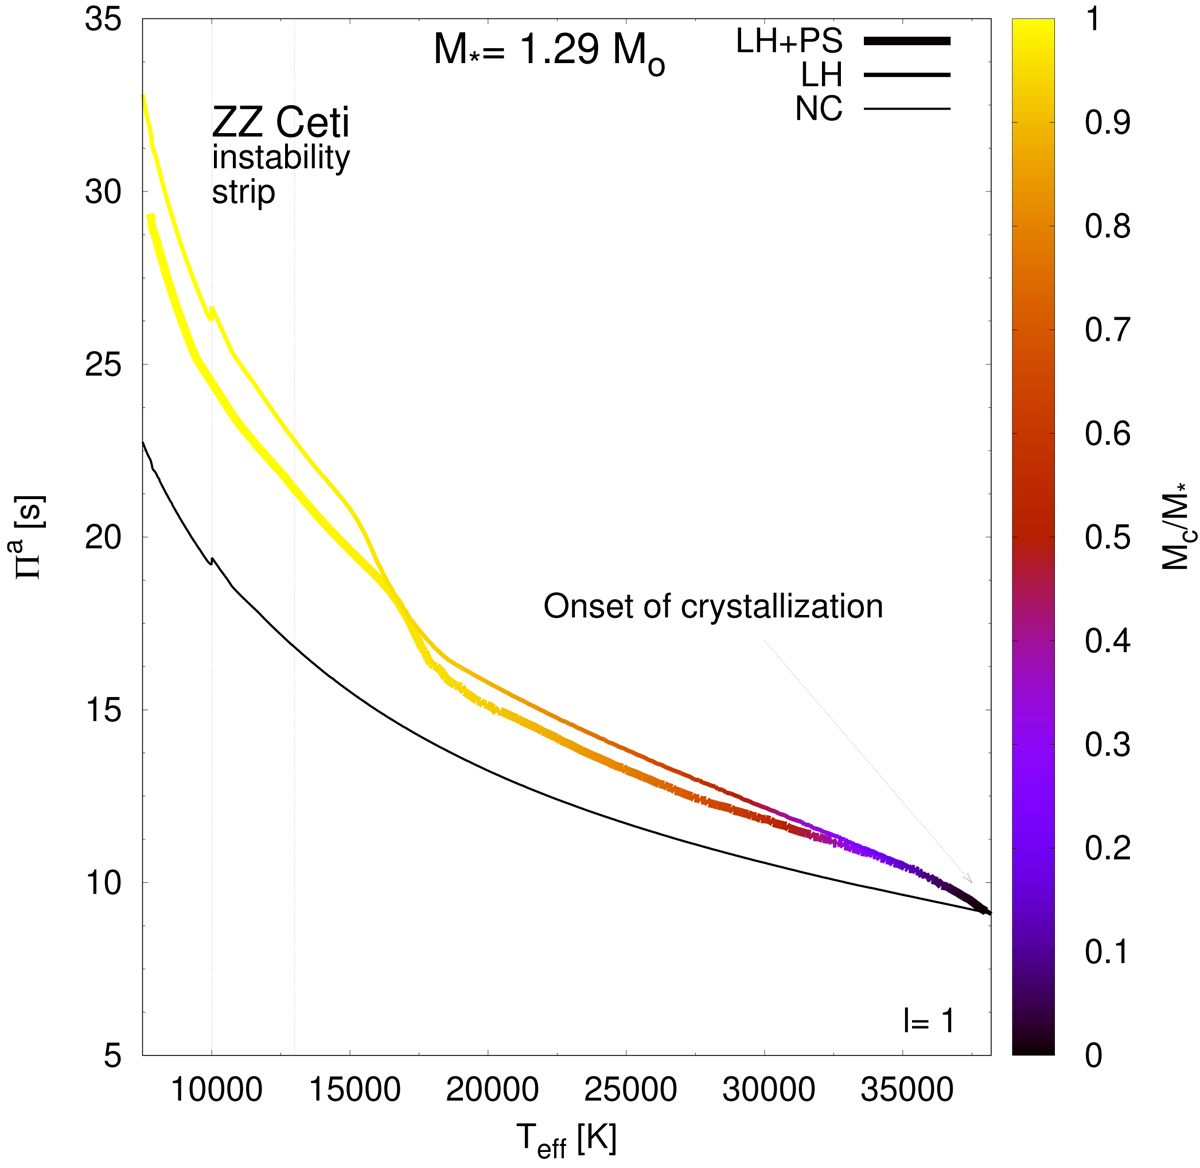
Dipole (ℓ = 1) asymptotic period spacing as a function of the effective temperature for the ONe evolutionary cooling sequence with mass M⋆ = 1.29 M⊙. The thick curve corresponds to the case in which latent heat and chemical redistribution caused by phase separation have been taken into account during crystallization (LH+PS case), the intermediate-thickness curve displays the case in which chemical redistribution caused by phase separation has been neglected (LH case), and the thin curve is associated with the case in which crystallization has been neglected (NC case). The palette of colors corresponds to the fraction of crystallized mass (Mc/M⋆). Vertical dotted lines show the Teff interval of the ZZ Ceti instability strip.
Current usage metrics show cumulative count of Article Views (full-text article views including HTML views, PDF and ePub downloads, according to the available data) and Abstracts Views on Vision4Press platform.
Data correspond to usage on the plateform after 2015. The current usage metrics is available 48-96 hours after online publication and is updated daily on week days.
Initial download of the metrics may take a while.