Fig. 1.
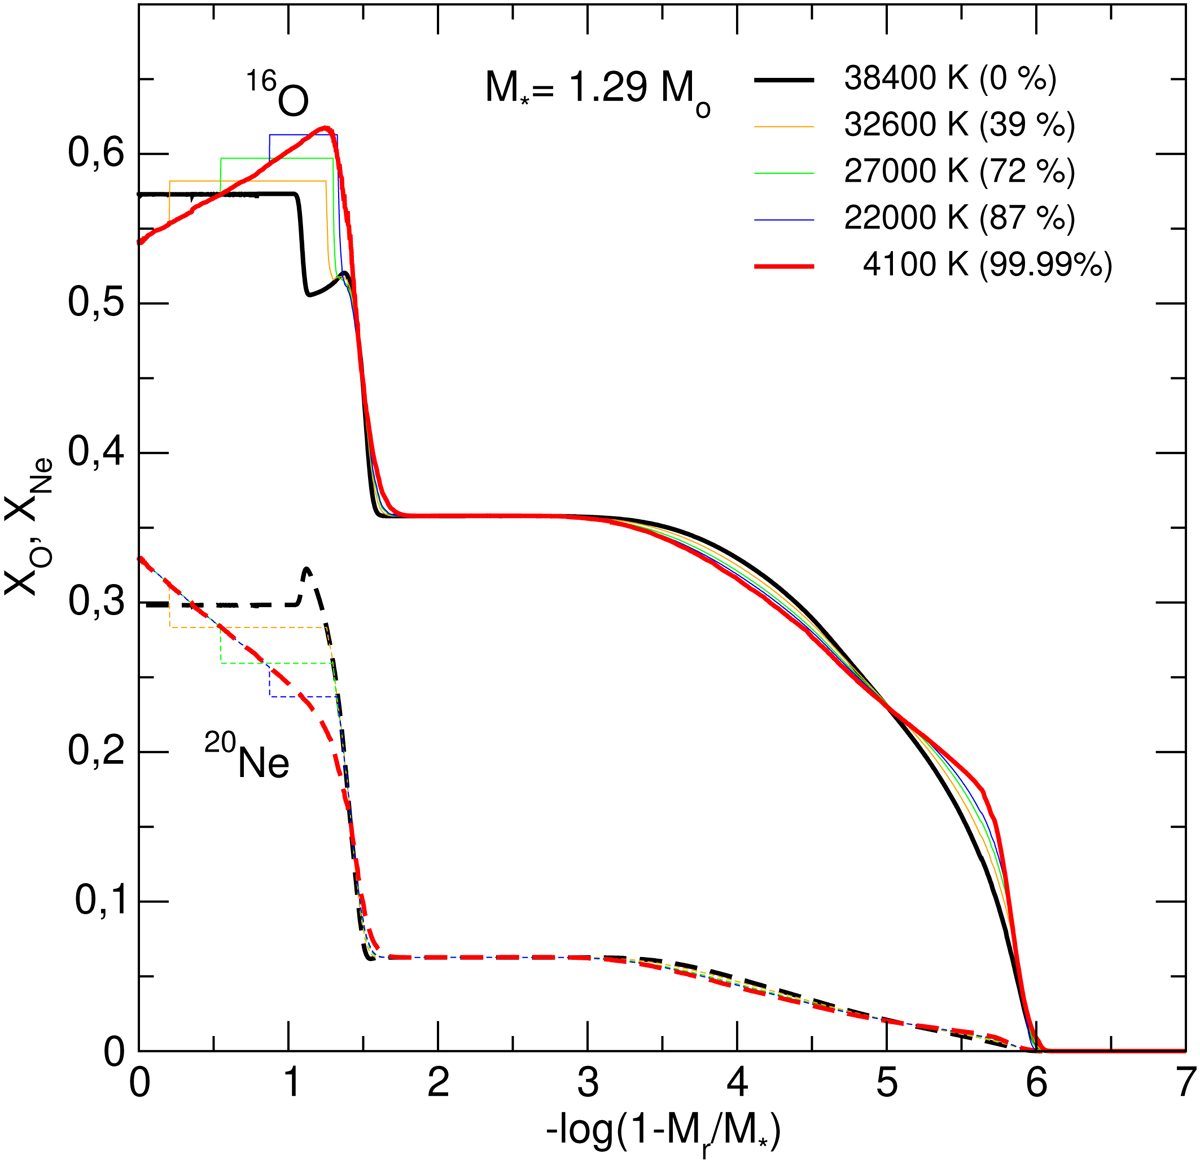
Internal chemical profiles of 16O (solid lines) and 20Ne (dashed lines) in terms of the fractional mass for the 1.29 M⊙ ONe-core WD sequence corresponding to various percentages of crystallization. The thick black lines correspond to the profiles before crystallization, and the thin lines of different colors correspond to the chemical profiles resulting from chemical rehomogenization for different effective temperatures at increasing percentages of crystallized mass fraction, as indicated for some selected cases. The thick red curves correspond to a model with Teff = 4046 K and a percentage of 99.99% of crystallized mass.
Current usage metrics show cumulative count of Article Views (full-text article views including HTML views, PDF and ePub downloads, according to the available data) and Abstracts Views on Vision4Press platform.
Data correspond to usage on the plateform after 2015. The current usage metrics is available 48-96 hours after online publication and is updated daily on week days.
Initial download of the metrics may take a while.