Free Access
Fig. 2.
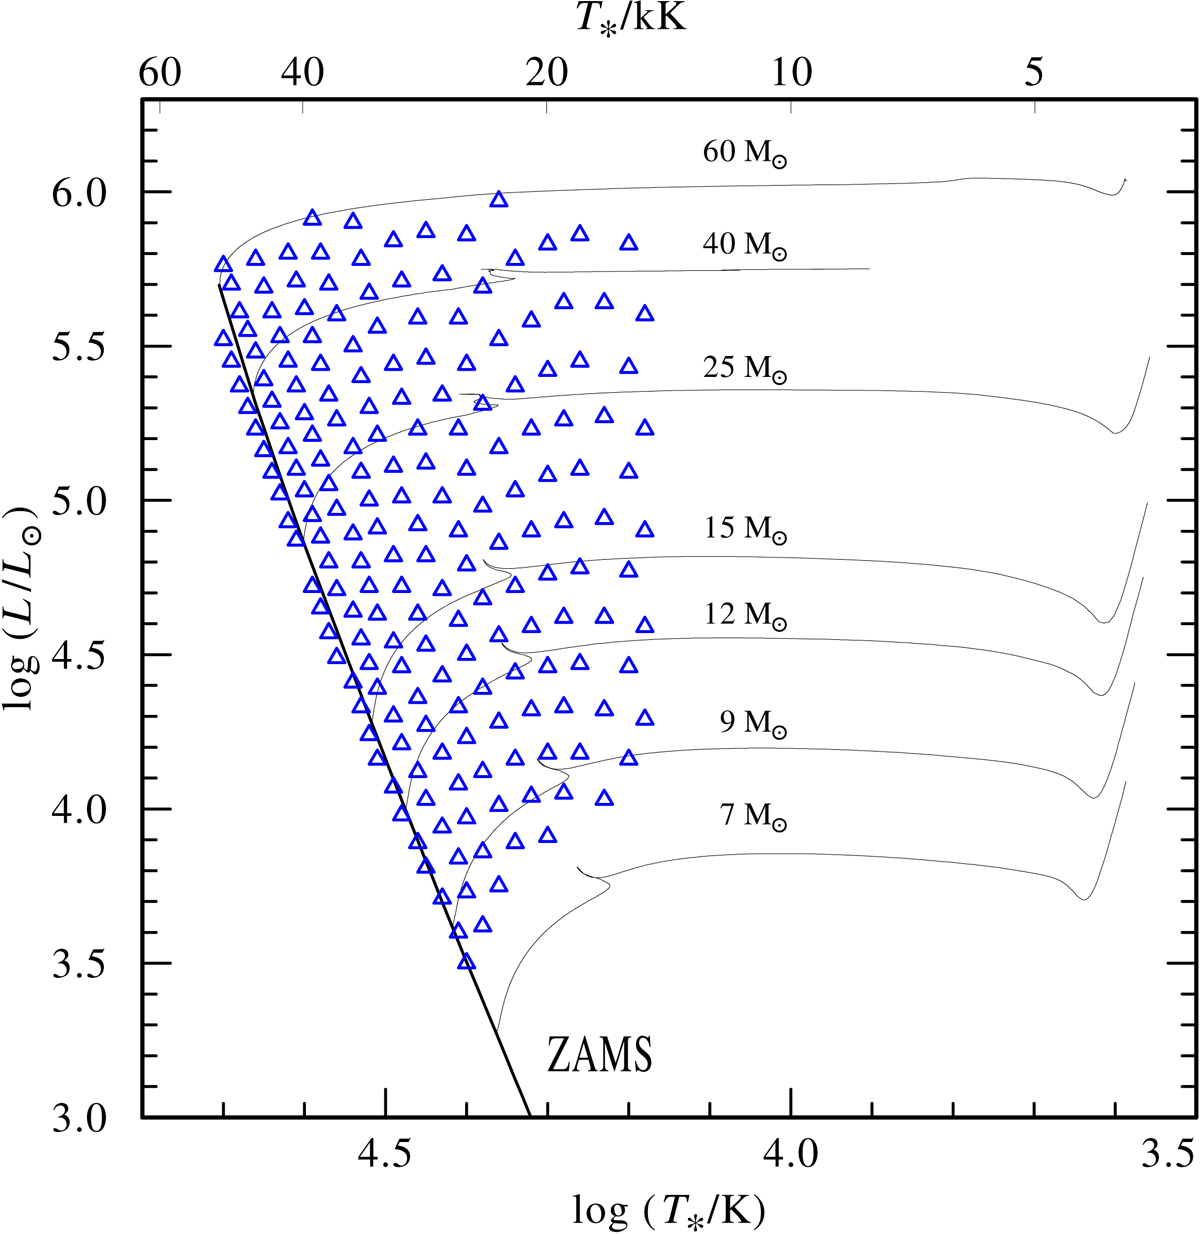
Hertzsprung–Russell diagram illustrating the coverage of the log T*-log L domain by our SMC model-grid. Each blue triangle refers to one grid model. The depicted stellar evolution tracks were calculated by Brott et al. (2011).
Current usage metrics show cumulative count of Article Views (full-text article views including HTML views, PDF and ePub downloads, according to the available data) and Abstracts Views on Vision4Press platform.
Data correspond to usage on the plateform after 2015. The current usage metrics is available 48-96 hours after online publication and is updated daily on week days.
Initial download of the metrics may take a while.