Free Access
Fig. 1.
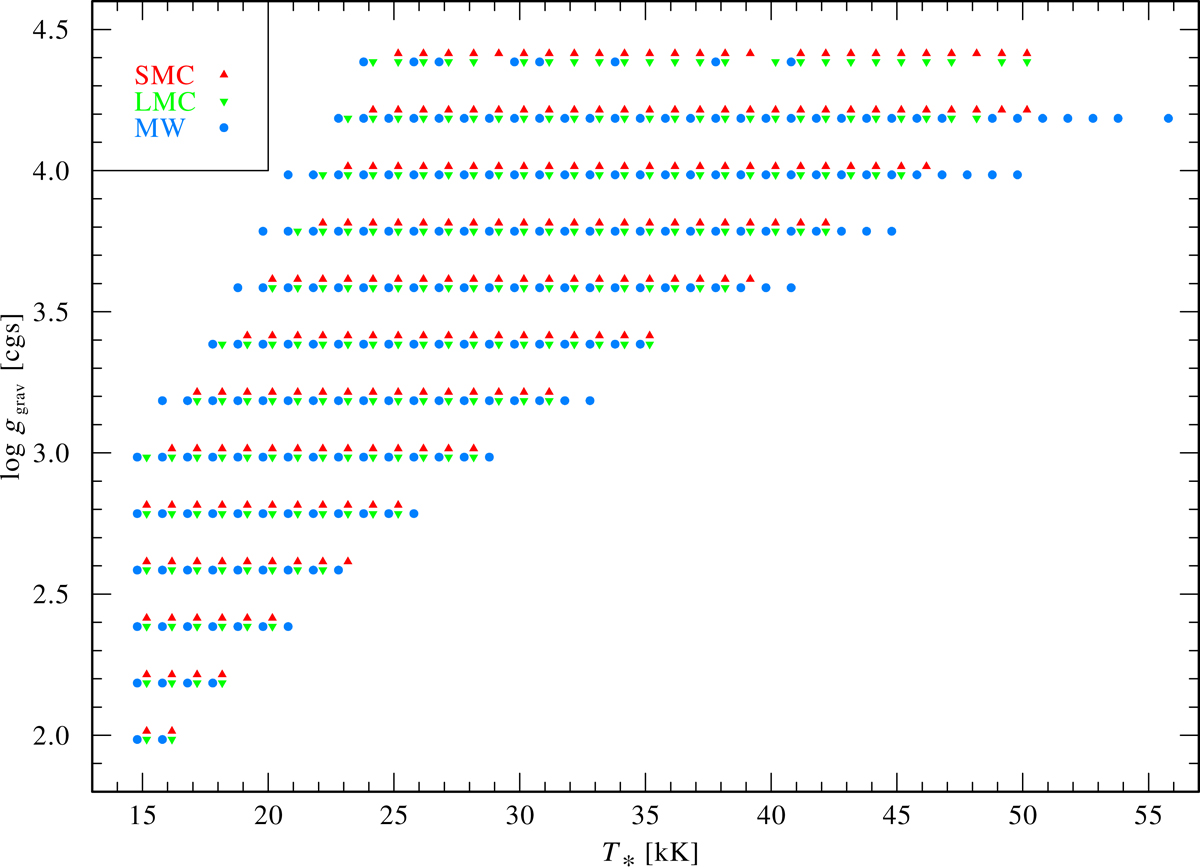
Overview of OB-type model grids in the T* − log ggrav plane. Each symbol represents an available PoWR model. The different colors and symbols indicate the different grids described in Sect. 3. The extension of the two SMC grids is identical.
Current usage metrics show cumulative count of Article Views (full-text article views including HTML views, PDF and ePub downloads, according to the available data) and Abstracts Views on Vision4Press platform.
Data correspond to usage on the plateform after 2015. The current usage metrics is available 48-96 hours after online publication and is updated daily on week days.
Initial download of the metrics may take a while.