Fig. 8
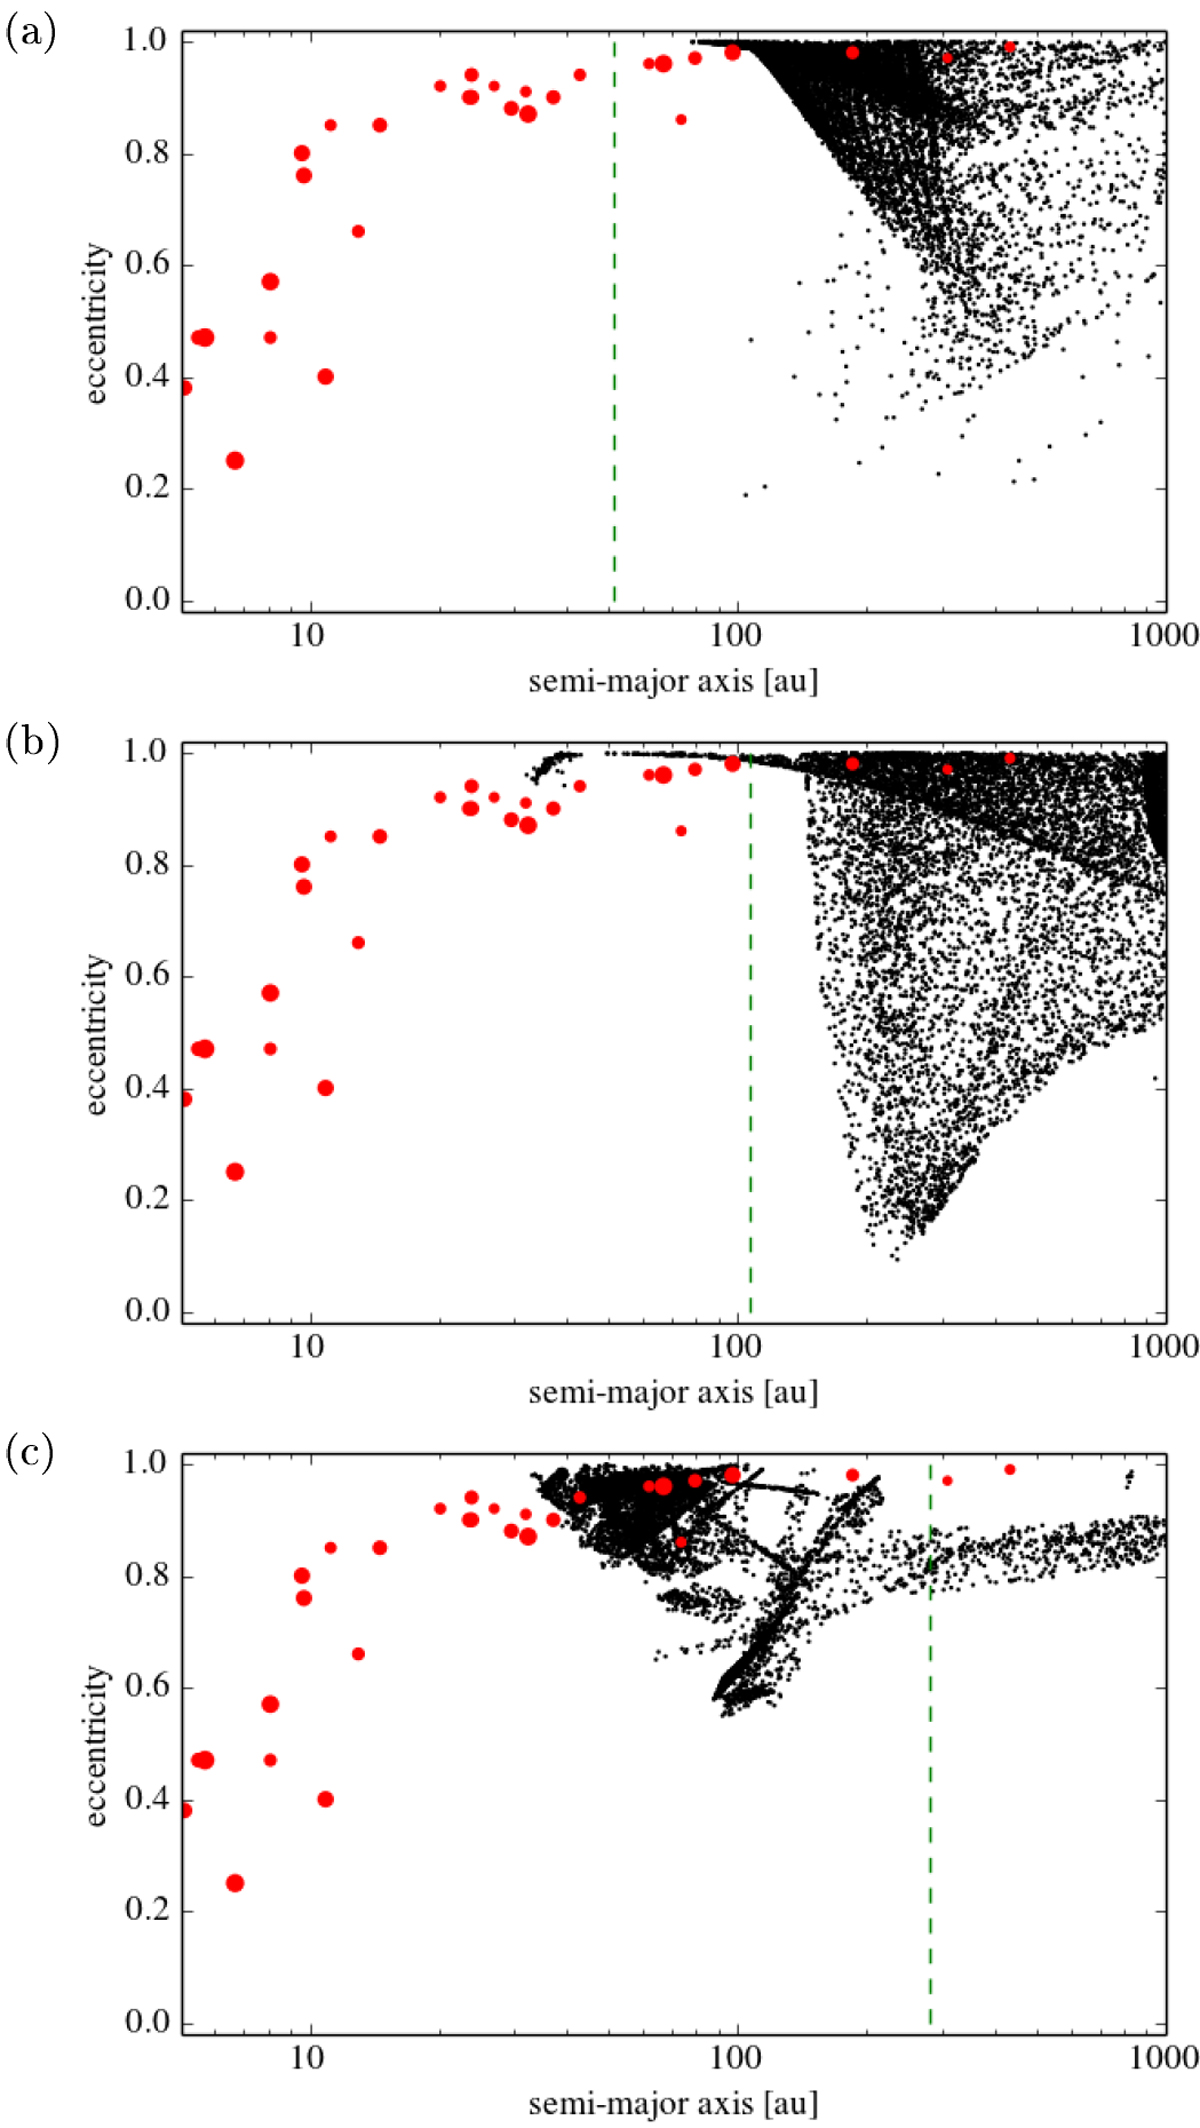
Distribution of counter-orbiting objects that can be produced by a parabolic, prograde, coplanar fly-by of a perturber with mass ratios of m = 0.1 (panel a), m = 1.0 (panel b), m = 20.0 (panel c), and pericentre that results in a mass-density drop at ≈30 au (black dots). The red circles show the solar system minor bodies from Table 6.
Current usage metrics show cumulative count of Article Views (full-text article views including HTML views, PDF and ePub downloads, according to the available data) and Abstracts Views on Vision4Press platform.
Data correspond to usage on the plateform after 2015. The current usage metrics is available 48-96 hours after online publication and is updated daily on week days.
Initial download of the metrics may take a while.