Fig. 28.
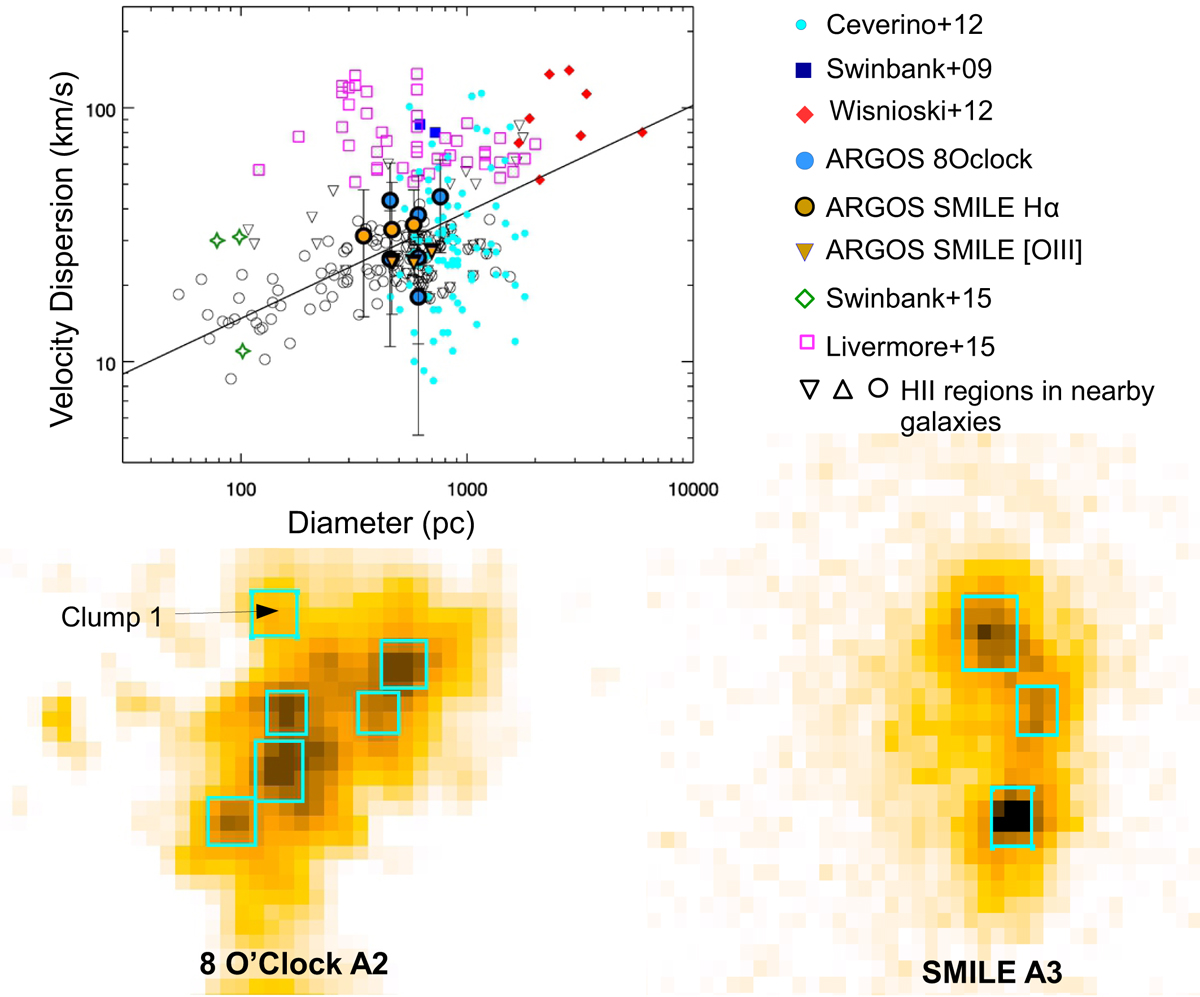
The σ-diameters relationship of clumps in high-redshift galaxies and in H II regions in nearby galaxies (upper panel). The position of the clumps selected on the A2 2D spectrum of the 8 o’clock arc (bottom left) and on the A3 2D spectrum of the SMILE arc (bottom right) fall on the relation obtained by Wisnioski et al. (2012; solid black line in the upper panel), but covers a range of clump sizes and velocity dispersion smaller than those reported in other high-redshift surveys and close to those followed by giant H II regions in the local Universe. Uncertainties for the velocity dispersion are overplotted denoting the Gaussian fit error in combination with the spectral resolution of the observation, i.e. 20 km s−1.
Current usage metrics show cumulative count of Article Views (full-text article views including HTML views, PDF and ePub downloads, according to the available data) and Abstracts Views on Vision4Press platform.
Data correspond to usage on the plateform after 2015. The current usage metrics is available 48-96 hours after online publication and is updated daily on week days.
Initial download of the metrics may take a while.