Fig. 27.
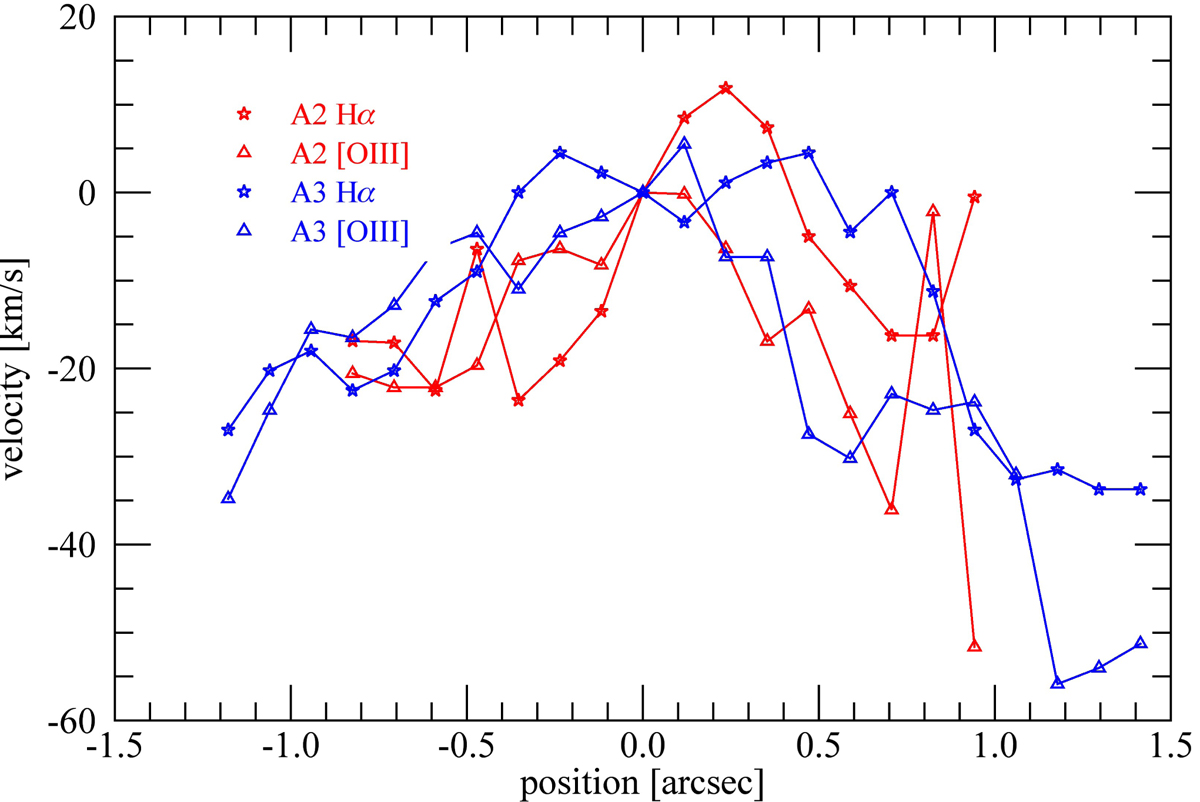
Kinematics of the two images A3 (blue) and A2 (red, reversed) in SDSS 1038+4849 derived from the Hα observations (stars) and from the [O IIIλ5007] observations (triangles). The resulting curves of A2 and A3 have the typical reversed U shape of interacting systems, suggesting that the A2 and A3 images are composed of at least three clumps that are interacting with each other.
Current usage metrics show cumulative count of Article Views (full-text article views including HTML views, PDF and ePub downloads, according to the available data) and Abstracts Views on Vision4Press platform.
Data correspond to usage on the plateform after 2015. The current usage metrics is available 48-96 hours after online publication and is updated daily on week days.
Initial download of the metrics may take a while.