Fig. 23.
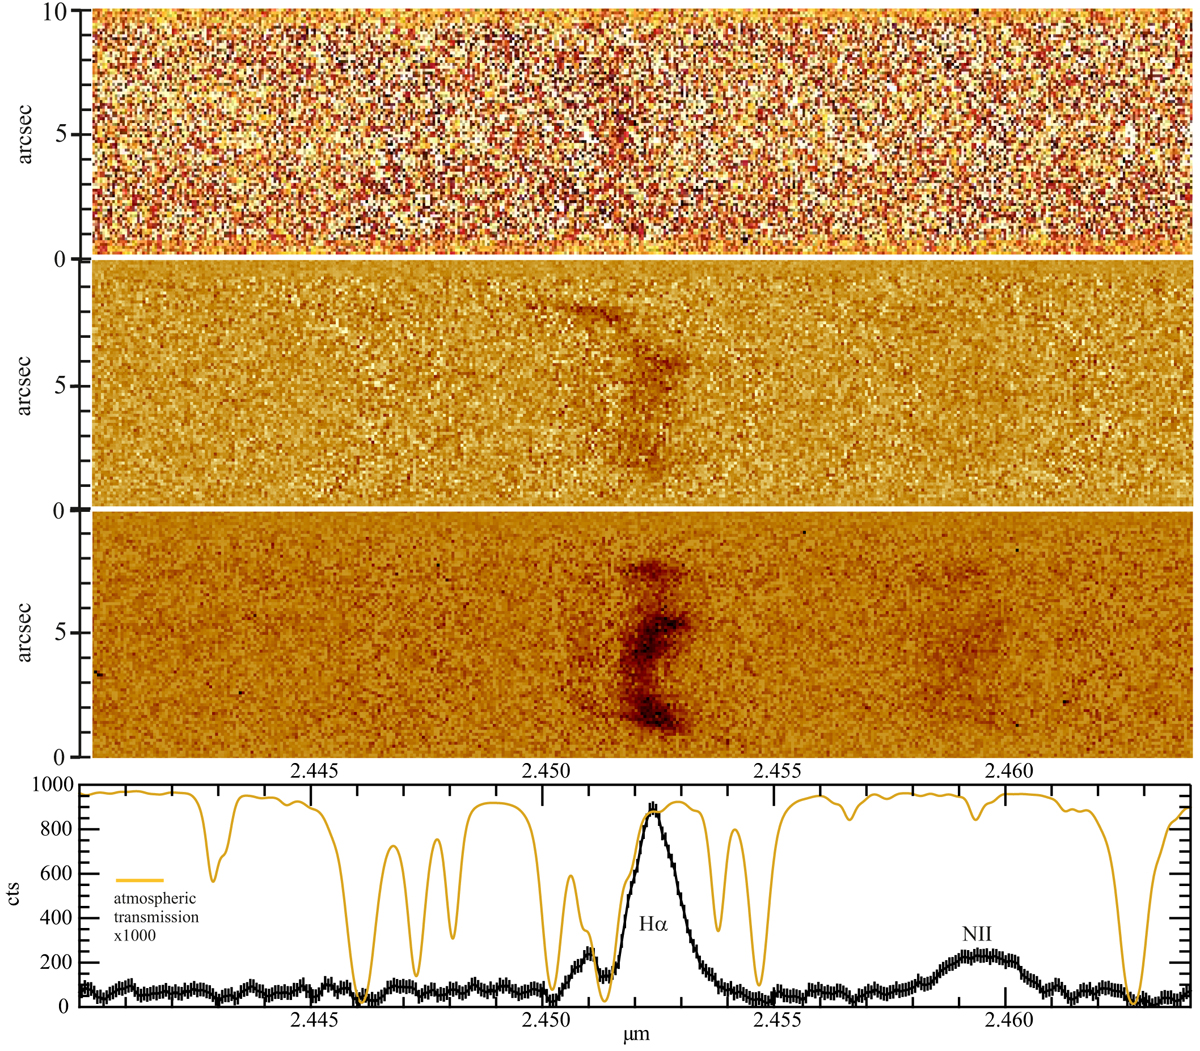
Emission lines Hα and [N II] detected from the 8 o’clock arc. From top to bottom: A 5 min integration with the ARGOS loop open; the emission is barely visible, due to the small slit width. A 5 min integration with the adaptive optics loop on; all the flux from the object is nicely squeezed into the curved slit. Combining multiple nodded integrations for an hour of observation and removing the slit curvature; the velocity distribution and a richness of details can be seen already. In the bottom panel a 1D spectrum is shown, formed by collapsing the 2D spectrum from above along the spatial axis. While this averages out all the velocity distribution that is seen above, it compares directly to data taken by others. The shown spectrum is not corrected for telluric absorption in the atmosphere, which is strong at that wavelength. To guide the readers eye a calculated absorption spectrum is overplotted in yellow, being responsible for some features in the spectrum, and contributes to the invisibility of the weaker second [N II] line at 2.4462 μm.
Current usage metrics show cumulative count of Article Views (full-text article views including HTML views, PDF and ePub downloads, according to the available data) and Abstracts Views on Vision4Press platform.
Data correspond to usage on the plateform after 2015. The current usage metrics is available 48-96 hours after online publication and is updated daily on week days.
Initial download of the metrics may take a while.