Fig. 21.
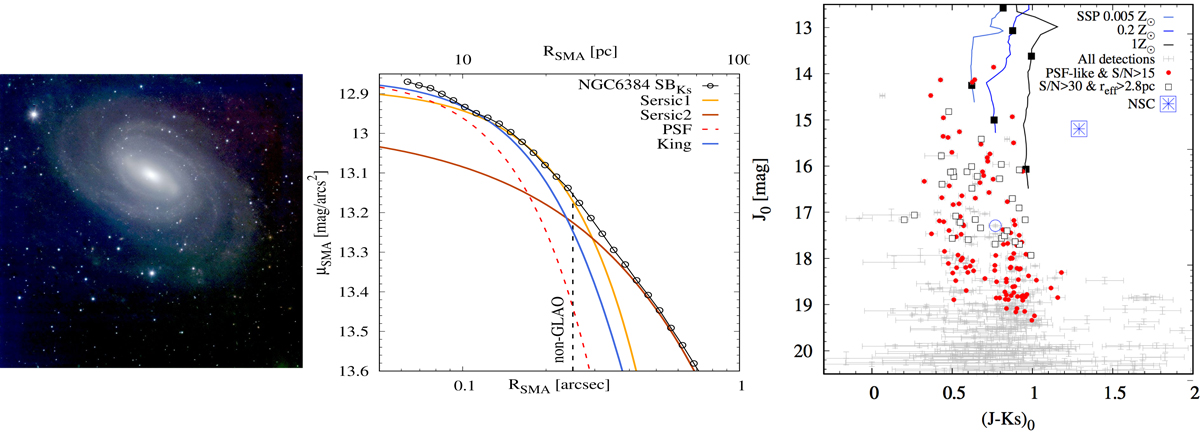
Left panel: Colour composite image of NGC 6384 from JHKs LUCI1&2 ARGOS commissioning data. Middle panel: 1D surface brightness profile decomposition of the central 100 pc around its nuclear cluster. Lines indicate the various components obtained via 2D modelling (see legend). A vertical dashed line indicates the non-GLAO PSF size. Right panel: Colour-magnitude diagram of PSF sources (solid red dots), extended objects (open squares), and all detections (light grey points) in the field. Figure adapted from Georgiev et al. (2018).
Current usage metrics show cumulative count of Article Views (full-text article views including HTML views, PDF and ePub downloads, according to the available data) and Abstracts Views on Vision4Press platform.
Data correspond to usage on the plateform after 2015. The current usage metrics is available 48-96 hours after online publication and is updated daily on week days.
Initial download of the metrics may take a while.