Fig. 18.
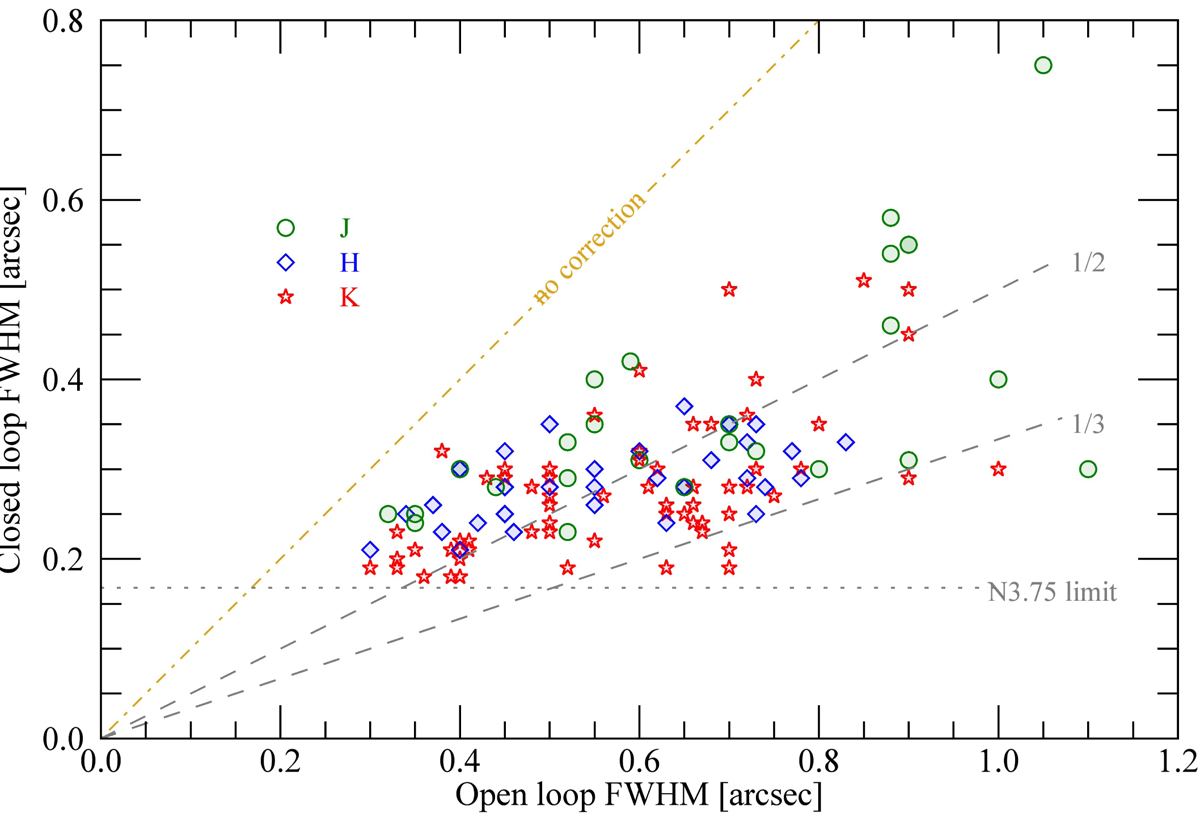
ARGOS commissioning performance plot, summarizing many imaging observations done during commissioning. Taking the open-loop FWHM points as seen in sky frames of an observation and overplotting the achieved GLAO FWHM, we can judge the “improvement” in FWHM. The plot shows 123 data points taken from 43 observations over the J, H, and K bands (green, blue, and red points, respectively). Lines mark the “factor 2” and “factor 3” improvement, and the yellow diagonal of “no correction”. The “N3.75 camera limit” marks the smallest possible size measurement with the specific camera in use, possessing a 0.118′′ pixel scale.
Current usage metrics show cumulative count of Article Views (full-text article views including HTML views, PDF and ePub downloads, according to the available data) and Abstracts Views on Vision4Press platform.
Data correspond to usage on the plateform after 2015. The current usage metrics is available 48-96 hours after online publication and is updated daily on week days.
Initial download of the metrics may take a while.