Fig. 13.
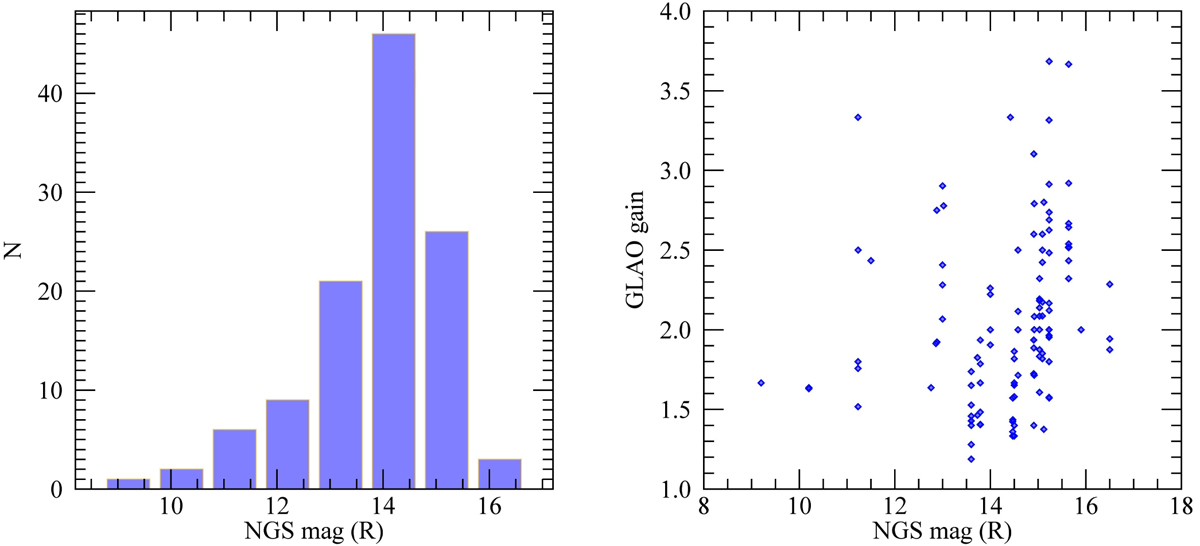
Left panel: histogram of the mag(R) of the NGS used in 100 science fields during 2016 and 2017 commissioning runs. The values represent the star magnitude taken from the NOMAD Catalog, as used to produce observing script. Right panel: distribution of the GLAO performance as a function of the NGS magnitude. The GLAO gain has been evaluated by the ratio between the full width half maximum (FWHM) measured in open-loop and closed-loop LUCI/ARGOS images. No clear trend is visible in the plot, suggesting a limited impact of the NGS brightness on the GLAO peformance.
Current usage metrics show cumulative count of Article Views (full-text article views including HTML views, PDF and ePub downloads, according to the available data) and Abstracts Views on Vision4Press platform.
Data correspond to usage on the plateform after 2015. The current usage metrics is available 48-96 hours after online publication and is updated daily on week days.
Initial download of the metrics may take a while.