Fig. 8.
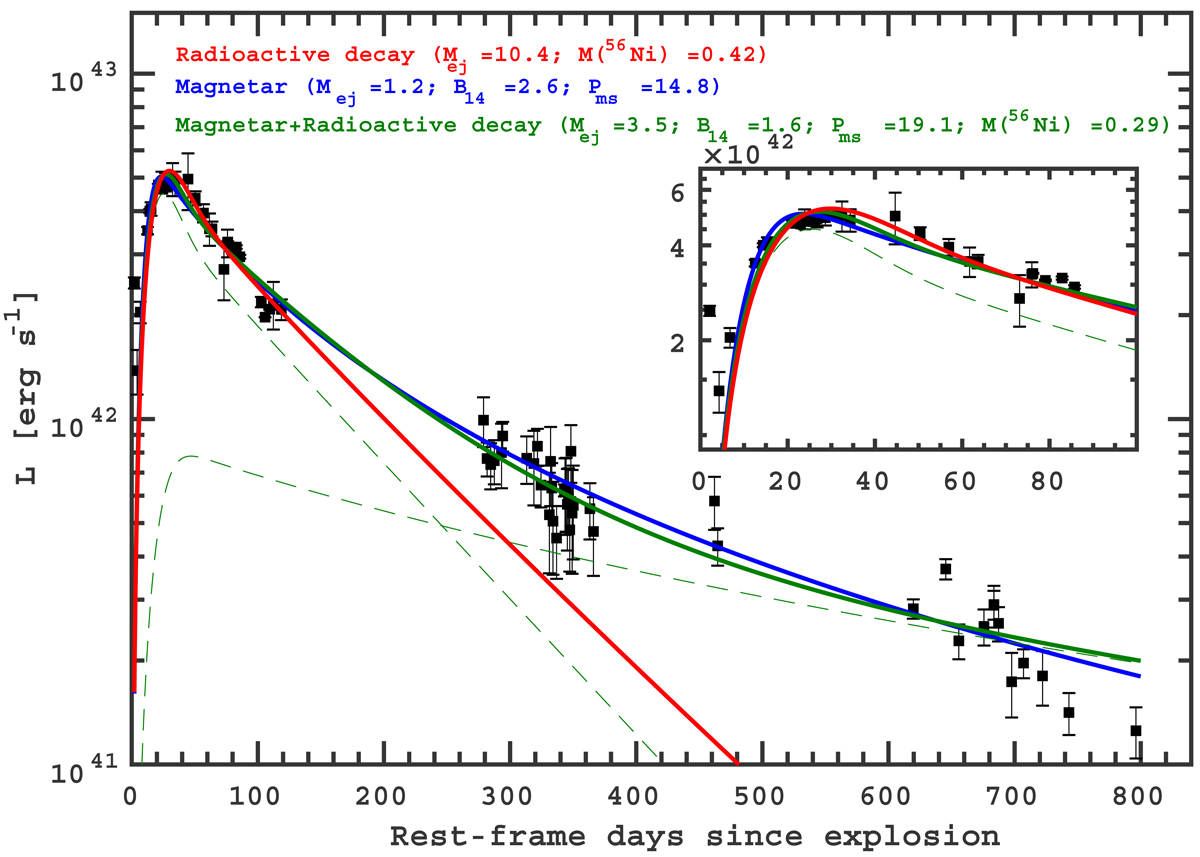
Bolometric light curve of iPTF15dtg from explosion until 800 d (rest-frame). For the first 150 d we adopt the bolometric light curve that was computed in T16. After that, we make use of our spectra to compute late-time bolometric corrections to the r-band light curve and hence obtain the luminosity at late epochs. We fit the bolometric light curve with three models: a purely radioactive model (red), a magnetar model (blue) and a hybrid model (green). The best fit parameters are reported in the corresponding colors. The two components of the hybrid model are shown by green dashed lines (at early epochs the radioactivity dominates, at late epochs the magnetar is prominent). The inset shows a zoomed view of the fits around the light curve peak.
Current usage metrics show cumulative count of Article Views (full-text article views including HTML views, PDF and ePub downloads, according to the available data) and Abstracts Views on Vision4Press platform.
Data correspond to usage on the plateform after 2015. The current usage metrics is available 48-96 hours after online publication and is updated daily on week days.
Initial download of the metrics may take a while.