Fig. 7.
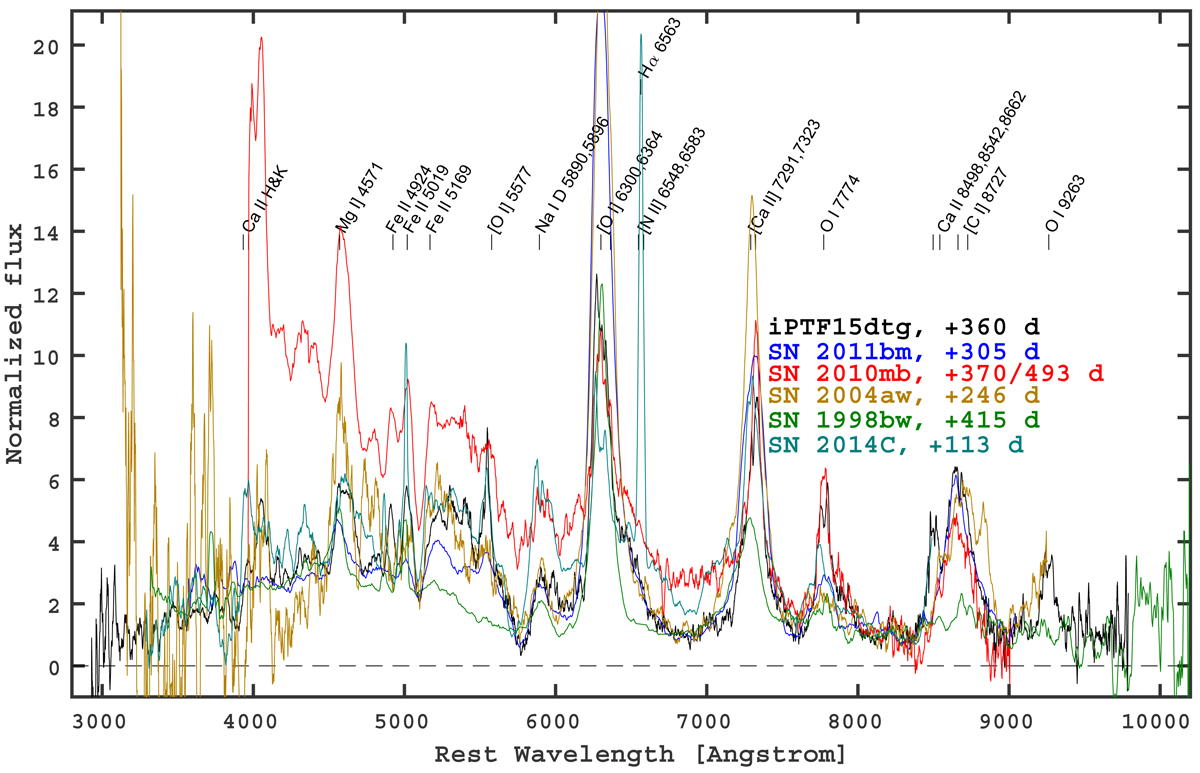
Normalized (divided by the median flux between 8000 and 8400 Å) spectra of iPTF15dtg (black), SN 2011bm (blue), SN 2010mb (red), SN 1998bw (green), SN 2004aw (orange), and SN 2014C (blue-green) at nebular epochs. All spectra were corrected for extinction. The main features are marked as in Fig. 5. The phases are reported for each SN. Supernova 2010mb is clearly different as its continuum is remarkably bluer than for the other SNe. Supernova 2014C shows strong Hα emission.
Current usage metrics show cumulative count of Article Views (full-text article views including HTML views, PDF and ePub downloads, according to the available data) and Abstracts Views on Vision4Press platform.
Data correspond to usage on the plateform after 2015. The current usage metrics is available 48-96 hours after online publication and is updated daily on week days.
Initial download of the metrics may take a while.