Fig. 5.
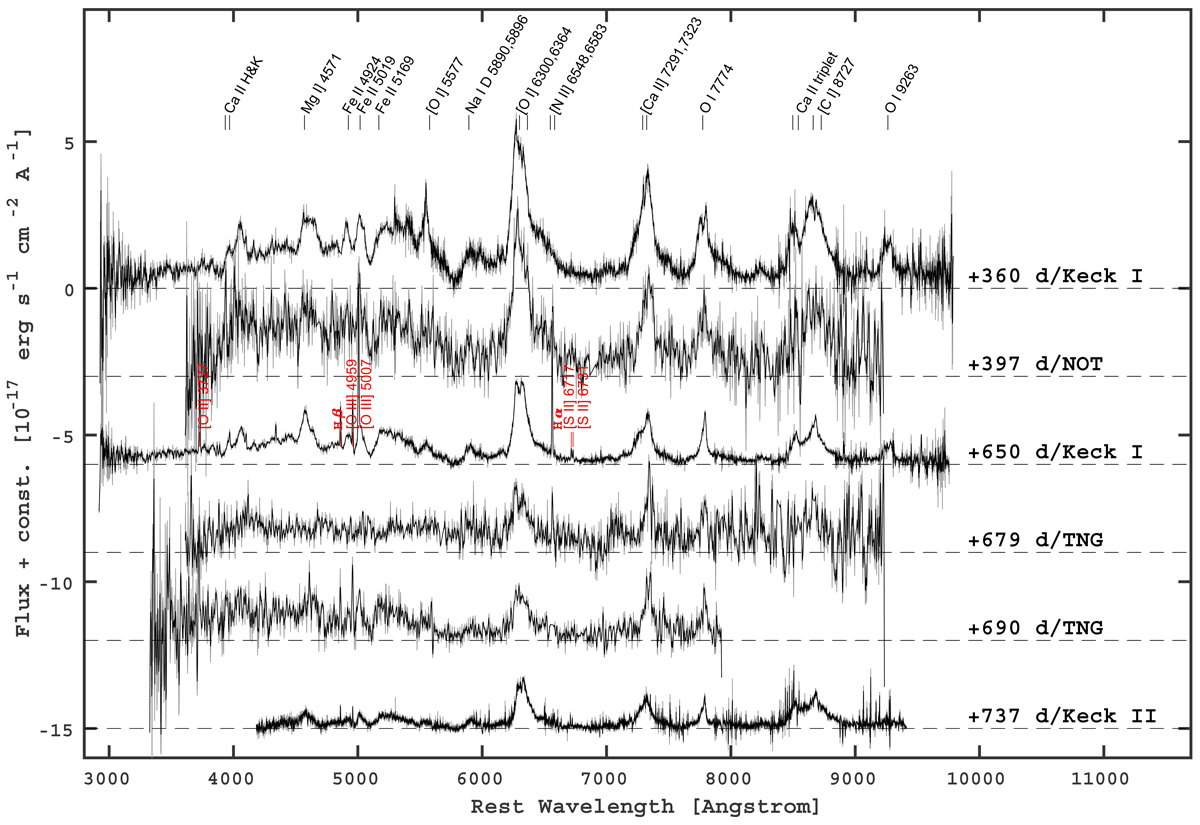
Late-time spectral sequence of iPTF15dtg. All the spectra are absolute-flux calibrated and shown in the rest frame. The zero-flux level for each spectrum is marked by a horizontal dashed line, as well as its phase and telescope. The main SN features are labeled in black at the top, those related to the host-galaxy emission, well visible in the third spectrum, are labeled in red.
Current usage metrics show cumulative count of Article Views (full-text article views including HTML views, PDF and ePub downloads, according to the available data) and Abstracts Views on Vision4Press platform.
Data correspond to usage on the plateform after 2015. The current usage metrics is available 48-96 hours after online publication and is updated daily on week days.
Initial download of the metrics may take a while.