Fig. 1.
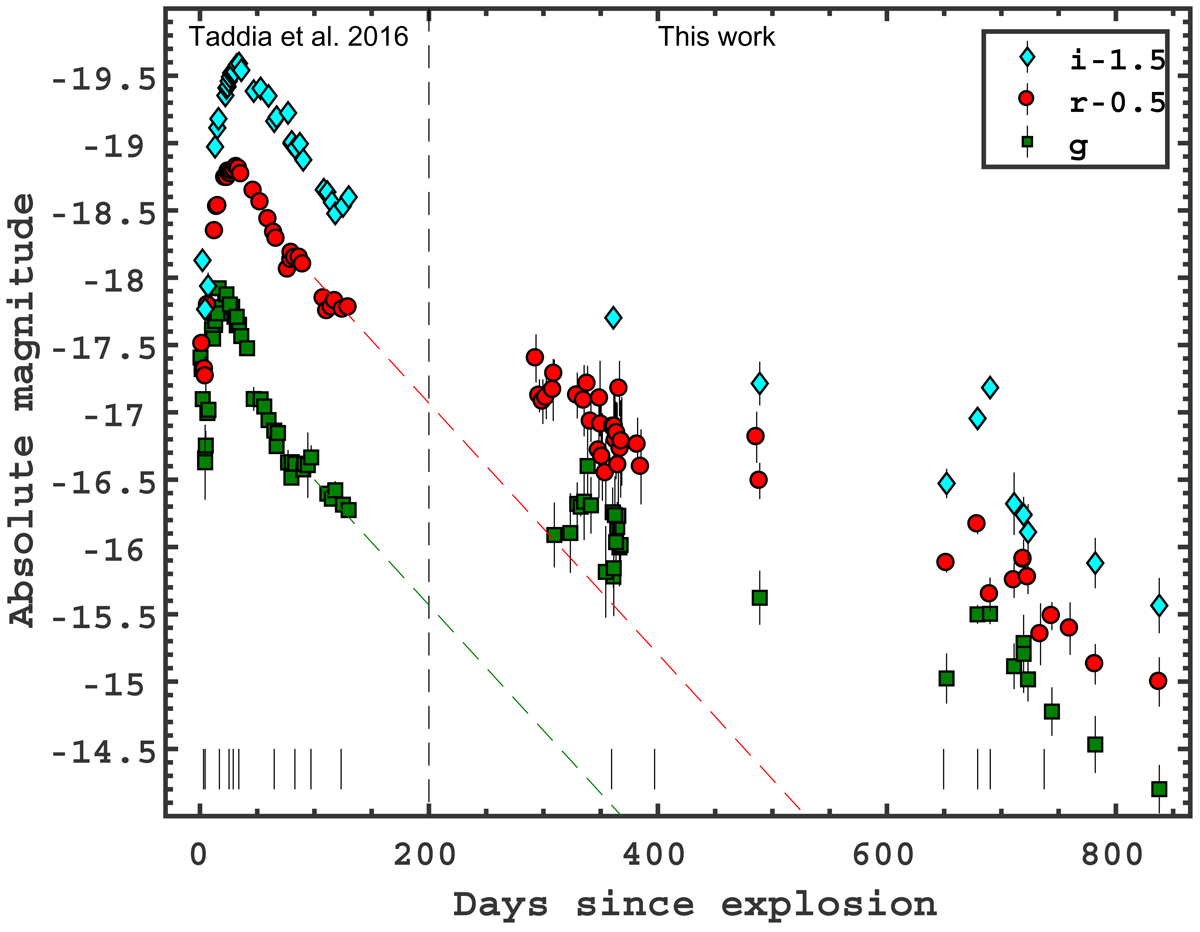
Absolute-magnitude light curves of iPTF15dtg in the gri filters in the observer frame. Each light curve was shifted by the amount indicated in the legend for clarity. The spectral epochs are reported as vertical black segments at the bottom. The 56Co decay rate is shown as dashed lines and scaled to both early g and r band photometry.
Current usage metrics show cumulative count of Article Views (full-text article views including HTML views, PDF and ePub downloads, according to the available data) and Abstracts Views on Vision4Press platform.
Data correspond to usage on the plateform after 2015. The current usage metrics is available 48-96 hours after online publication and is updated daily on week days.
Initial download of the metrics may take a while.