Free Access
Fig. 9
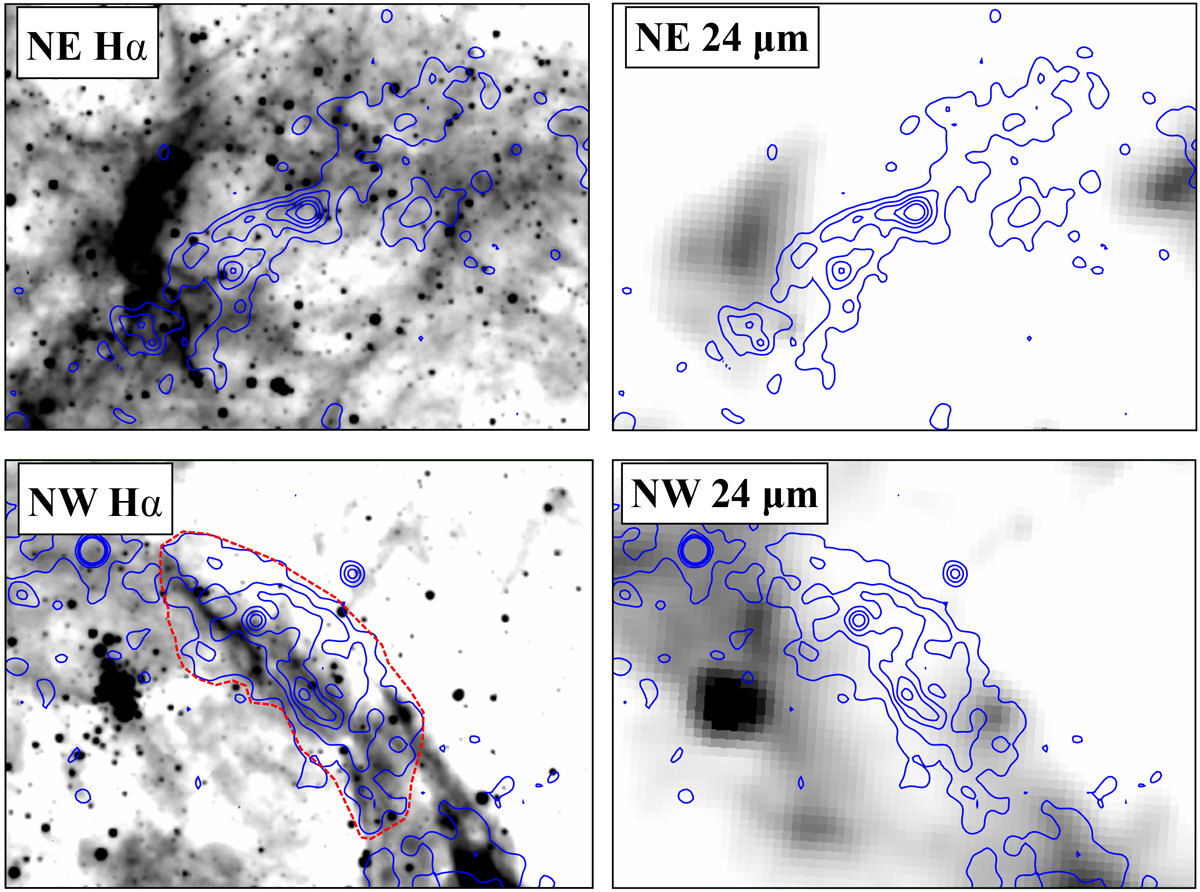
MCELS2 Hα and 24 μm images of the NE and NW shells of 30 Dor C with 1.5–8 keV contours overlaid. The contour levels were manually set to highlight the brightest regions of the synchrotron shell. The red region overlaid on the NW Hα image in bottom-left corresponds to the spectral extraction region used in Sect. 4.3.
Current usage metrics show cumulative count of Article Views (full-text article views including HTML views, PDF and ePub downloads, according to the available data) and Abstracts Views on Vision4Press platform.
Data correspond to usage on the plateform after 2015. The current usage metrics is available 48-96 hours after online publication and is updated daily on week days.
Initial download of the metrics may take a while.