Fig. 4
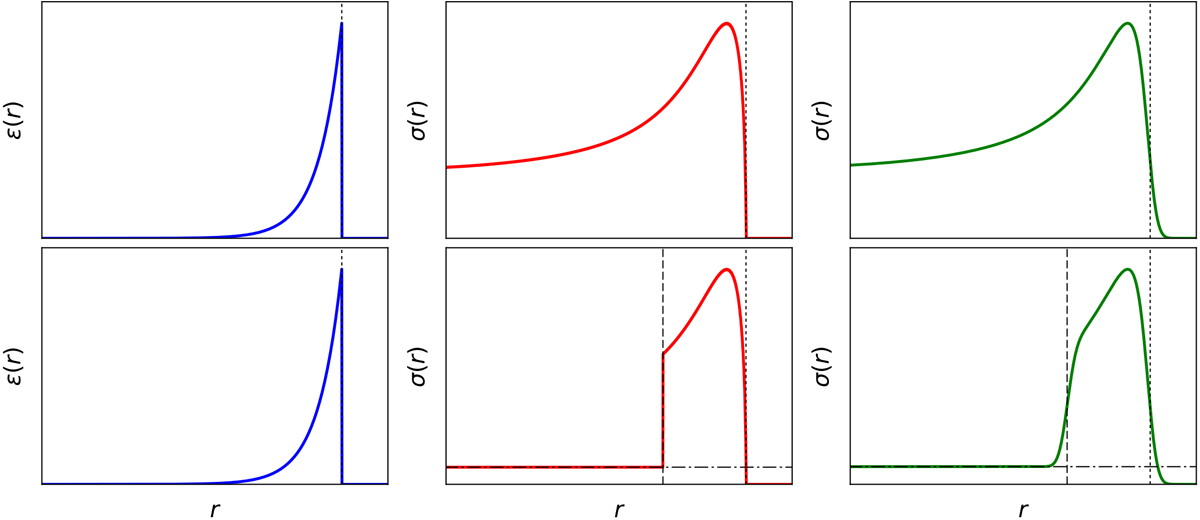
Illustration of projected and convolved volumetric emissivity profiles fitted to the segment profiles. Top row: postshock volumetric emissivity profile with radius R (dotted lines) in Eq. (3) (left panel), projected emissivity profile using Eq. (2) (middle panel), and convolved with the PSF (right panel). Bottom row: same as top but for the projected “cap” model in Eq. (4). The same postshock volumetric emissivity profile is used (left panel). The projected emissivity profile is modified to fall to a fitted background value b (dash-dot lines) below rf which is a fraction rc of the shell radius R, r < rf = rcR (middle panel, dashed lines). This was then convolved with the PSF (right panel).
Current usage metrics show cumulative count of Article Views (full-text article views including HTML views, PDF and ePub downloads, according to the available data) and Abstracts Views on Vision4Press platform.
Data correspond to usage on the plateform after 2015. The current usage metrics is available 48-96 hours after online publication and is updated daily on week days.
Initial download of the metrics may take a while.