Free Access
Fig. 2
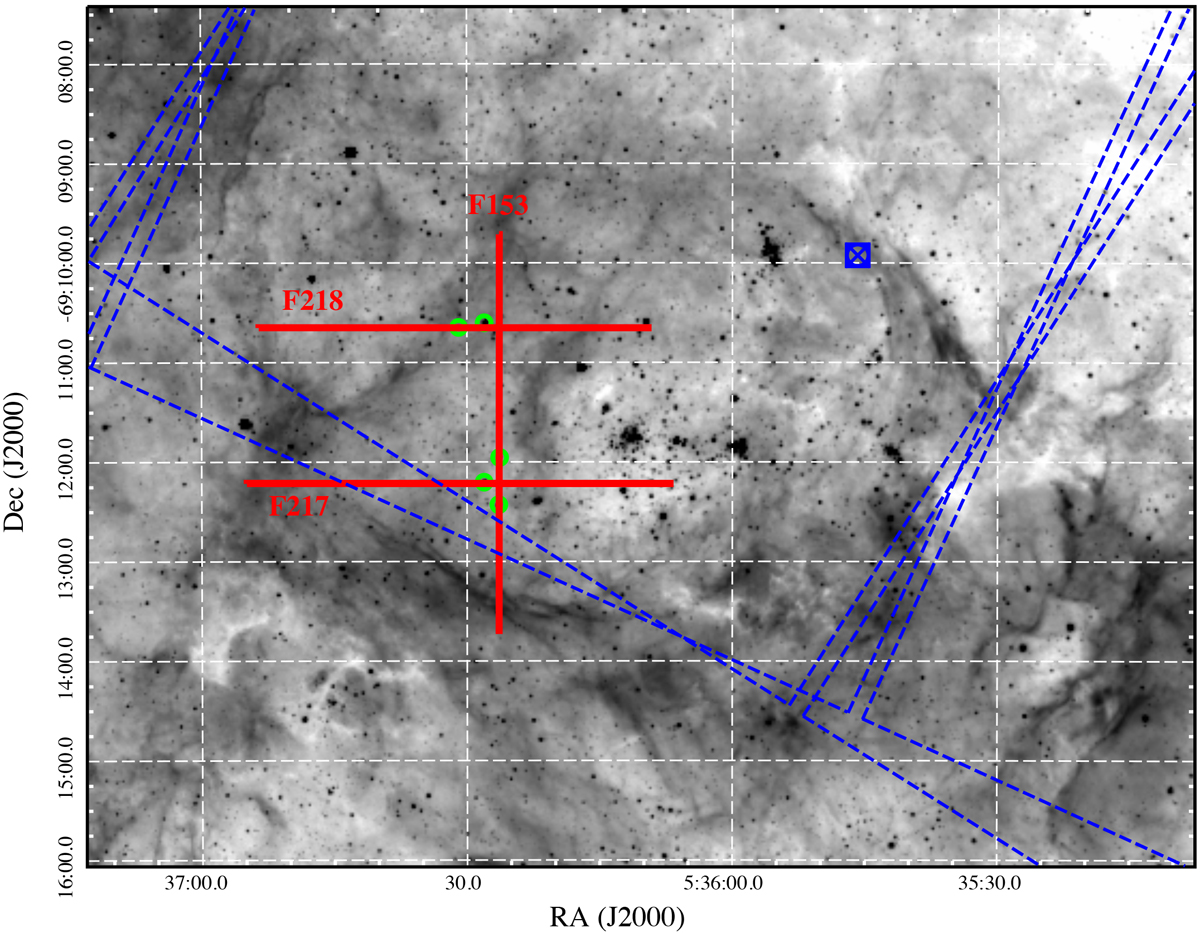
MCELS2 Hα image of 30 Dor C. The positions of optical spectroscopic slits are indicated by the red lines. The contaminating point sources are marked by the green circles. The blue circle-cross point marks the aim-point of the Chandra observations with the blue dashed lines delineating the ACIS-S coverage.
Current usage metrics show cumulative count of Article Views (full-text article views including HTML views, PDF and ePub downloads, according to the available data) and Abstracts Views on Vision4Press platform.
Data correspond to usage on the plateform after 2015. The current usage metrics is available 48-96 hours after online publication and is updated daily on week days.
Initial download of the metrics may take a while.