Fig. 5.
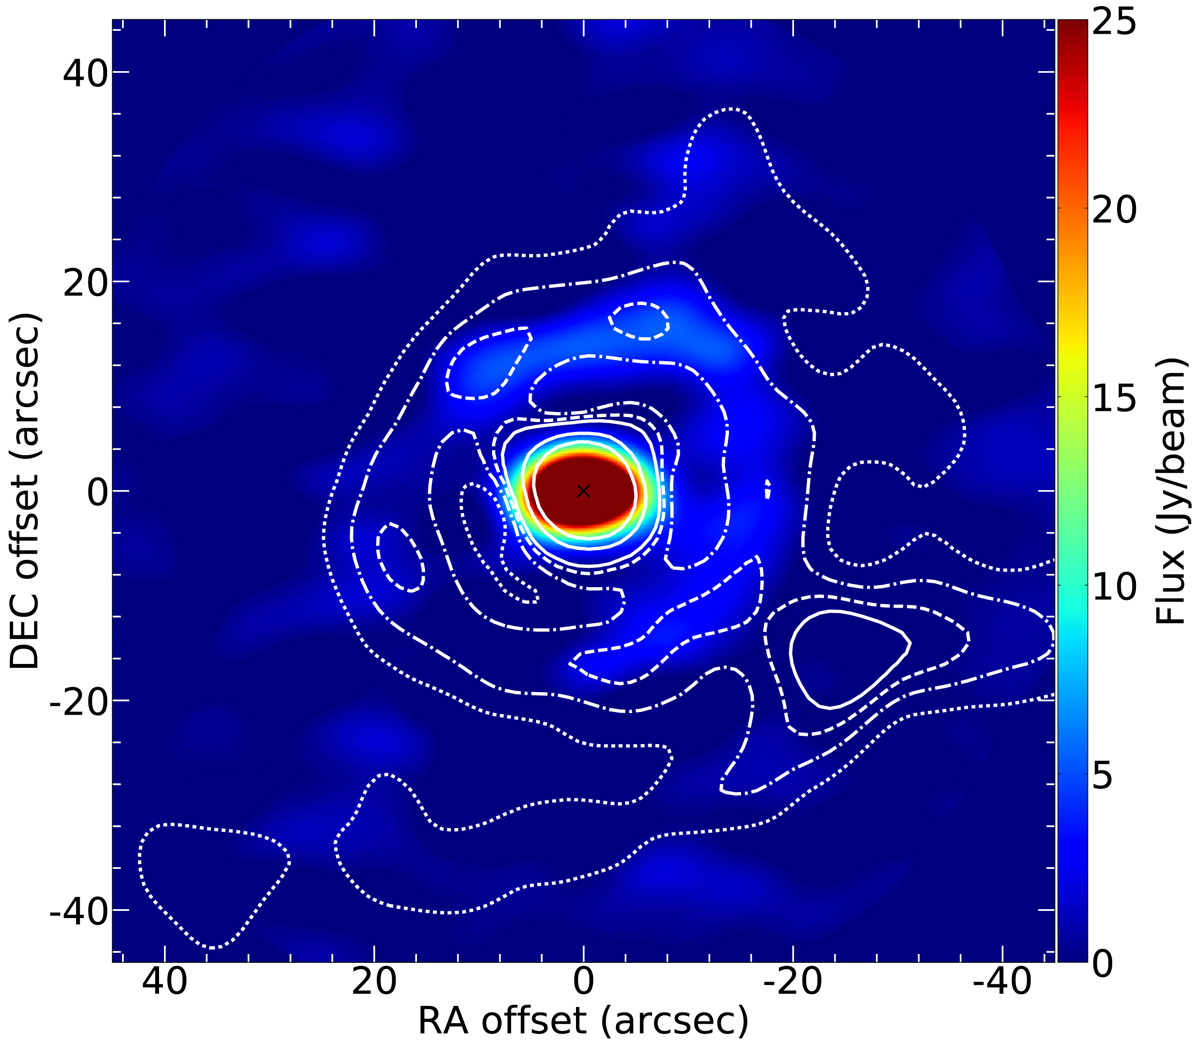
Integrated intensity (moment 0) map of the CO(2–1) emission observed with the ACA (colourscale) overlaid with contours of the Herschel/PACS dust emission. North is up, east is left. The stellar position is marked with a black cross. The contours are plotted in white at 1.1σ (dotted lines), 1.2σ (dash-dotted lines), 1.3σ (dashed lines), 1.4σ, 2σ, and 3σ (solid lines).
Current usage metrics show cumulative count of Article Views (full-text article views including HTML views, PDF and ePub downloads, according to the available data) and Abstracts Views on Vision4Press platform.
Data correspond to usage on the plateform after 2015. The current usage metrics is available 48-96 hours after online publication and is updated daily on week days.
Initial download of the metrics may take a while.