Fig. 8.
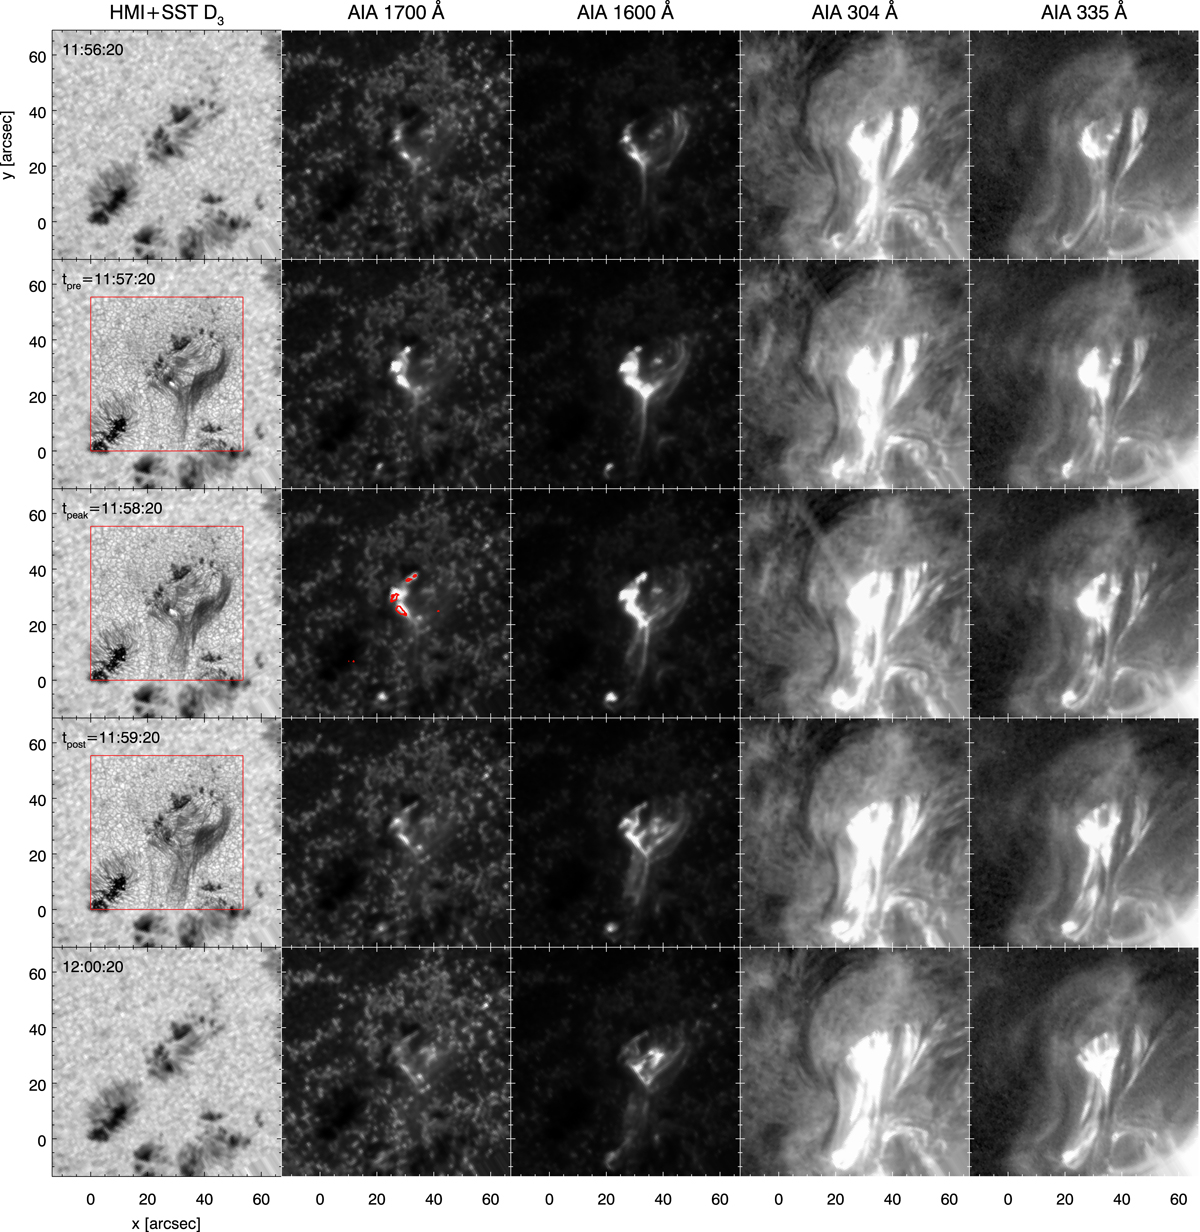
Context for the C3.6 class flare from SDO/AIA and SDO/HMI. From left to right we display SDO/HMI continuum, SDO/AIA 1700 Å, SDO/AIA 1600 Å, SDO/AIA 304 Å and SDO/AIA 335Å. From top to bottom we display five different time steps as indicated in the left corner of the images in the first column. In the first column, we have overplotted the SST field-of-view at the He I D3 line core λ = 0 Å, at the time steps where it was available, as indicated by the red box. We indicated the He I D3 emission contours corresponding to the SDO/AIA 1700 Å emission areas.
Current usage metrics show cumulative count of Article Views (full-text article views including HTML views, PDF and ePub downloads, according to the available data) and Abstracts Views on Vision4Press platform.
Data correspond to usage on the plateform after 2015. The current usage metrics is available 48-96 hours after online publication and is updated daily on week days.
Initial download of the metrics may take a while.