Fig. 7.
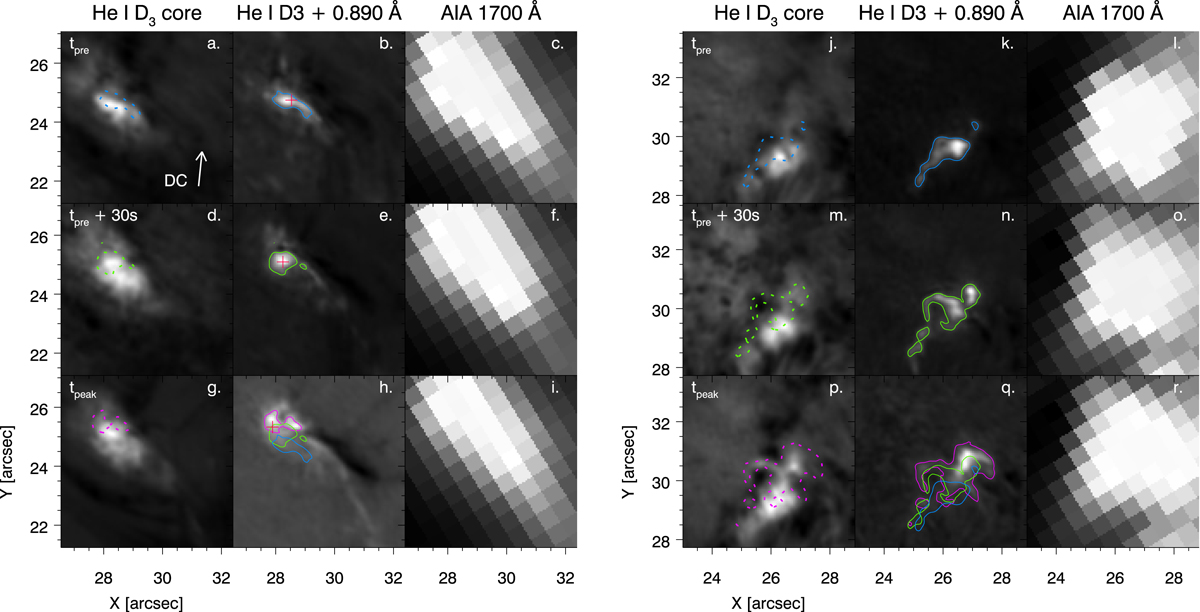
Magnification of the two largest He I D3 emission kernels in the data at three different time steps tpre, tpre + 30 s and tpeak. An image in the He I D3 line core an at a redshifted wavelength point of Δλ = 890 mÅ is shown. Co-aligned SDO 1700 Å images are shown as well, with the original pixel scale preserved. The red plus marks in panels b, e, and h correspond to the profiles displayed in Fig. 9. The solid line contours in the images at the He I D3 red wing show an intensity threshold in that image. The same contours are overplotted as dashed lines in the He I D3 line core images and in panels h and q to demonstrate a time and space lag.
Current usage metrics show cumulative count of Article Views (full-text article views including HTML views, PDF and ePub downloads, according to the available data) and Abstracts Views on Vision4Press platform.
Data correspond to usage on the plateform after 2015. The current usage metrics is available 48-96 hours after online publication and is updated daily on week days.
Initial download of the metrics may take a while.