Free Access
Fig. 5.
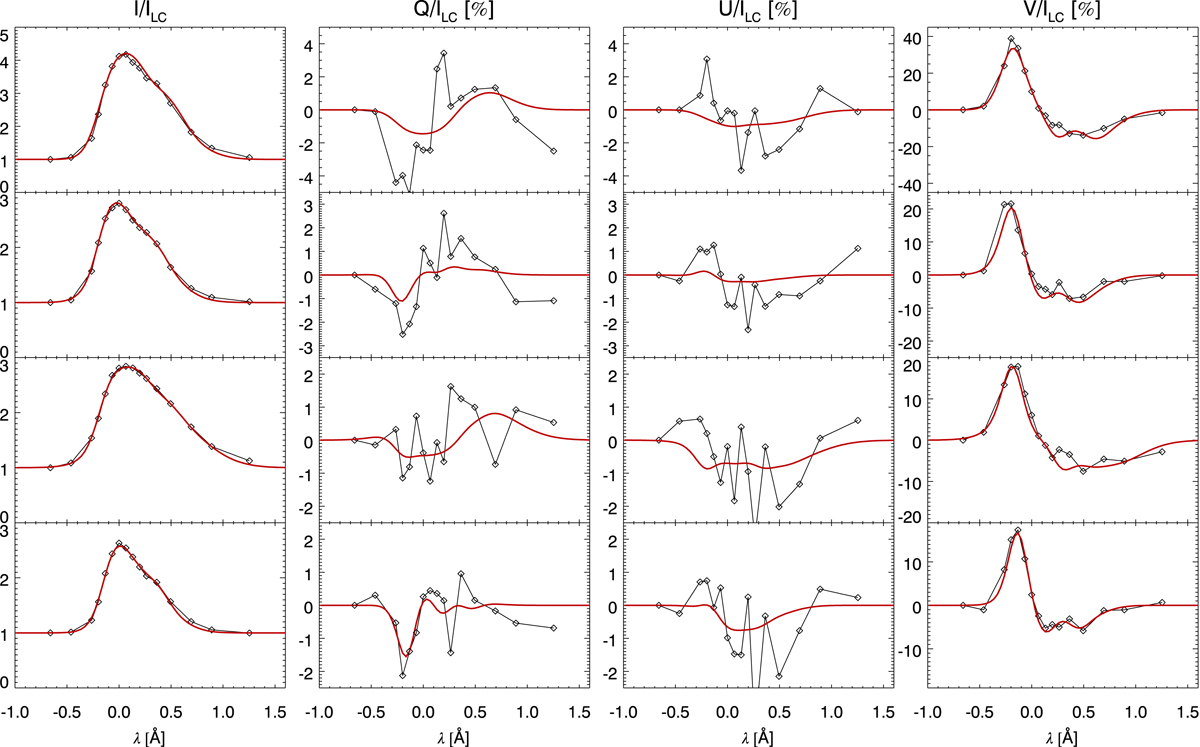
Some examples of the quality of the two-component fits to the stokes parameters of the He I D3 emission profiles. Black diamonds indicate the observed wavelength points, the black line connects the observed points and the red line indicates the fitted result. All profiles are normalized using the local continuum ILC.
Current usage metrics show cumulative count of Article Views (full-text article views including HTML views, PDF and ePub downloads, according to the available data) and Abstracts Views on Vision4Press platform.
Data correspond to usage on the plateform after 2015. The current usage metrics is available 48-96 hours after online publication and is updated daily on week days.
Initial download of the metrics may take a while.