Fig. 4.
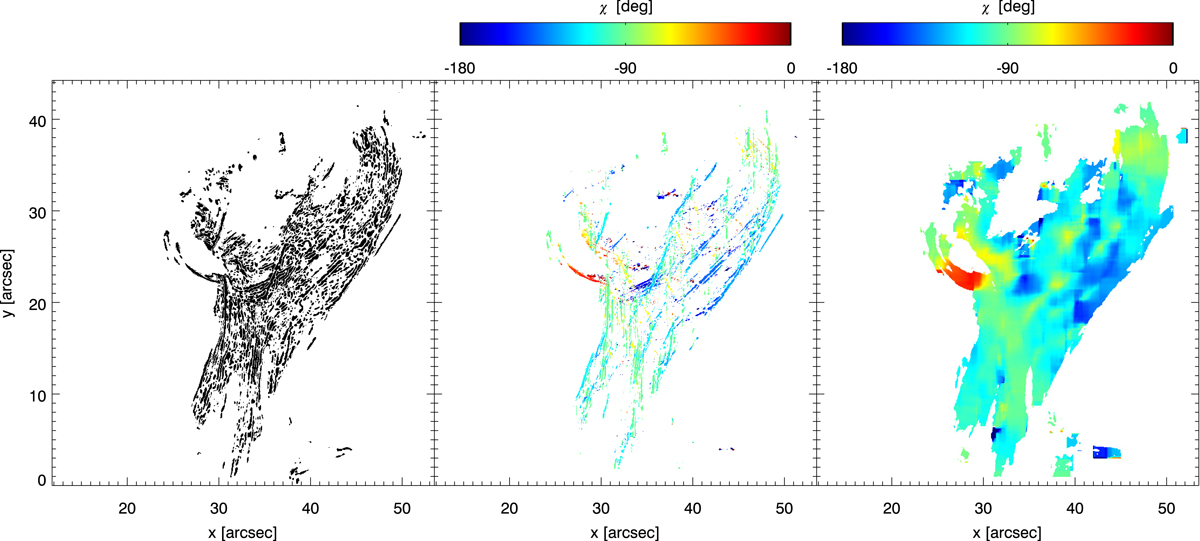
Demonstration of the Rolling Hough Transform method to select loops and measure their orientation. Left panel: masked image highlighting linear structure. Middle panel: selected loops exhibiting a dominant orientation with a measurement of their orientation. Right panel: smoothed version of the middle panel, used as an input for the azimuth in our inversions.
Current usage metrics show cumulative count of Article Views (full-text article views including HTML views, PDF and ePub downloads, according to the available data) and Abstracts Views on Vision4Press platform.
Data correspond to usage on the plateform after 2015. The current usage metrics is available 48-96 hours after online publication and is updated daily on week days.
Initial download of the metrics may take a while.