Fig. 3.
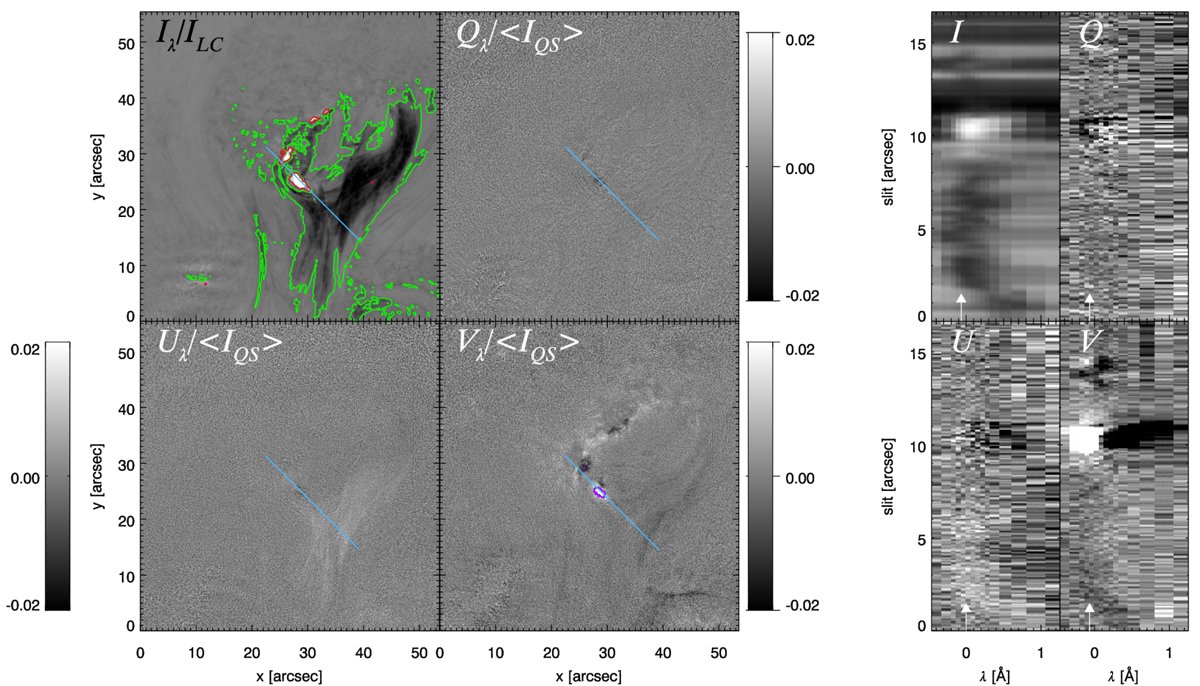
Stokes parameters of the in the He I D3 line at tpeak. The four panels on the left show the flare images, while the four panels on the right show the flare spectra. The Stokes I image has been corrected with the local continuum ILC. The Stokes Q, U and V images have been divided by an average patch of quiet sun intensity 〈IQS〉. The spectra are extracted along the blue line overplotted on the images. The white arrow on the spectra indicates the wavelength position at which the images are shown. The red contours overplotted on the Stokes I image indicate the areas of He I D3 emission, the green contours indicate the He I D3 absorption structure as determined from the k-NN algorithm. The purple contour overplotted on the Stokes V image indicate areas where the signal is larger than 0.02.
Current usage metrics show cumulative count of Article Views (full-text article views including HTML views, PDF and ePub downloads, according to the available data) and Abstracts Views on Vision4Press platform.
Data correspond to usage on the plateform after 2015. The current usage metrics is available 48-96 hours after online publication and is updated daily on week days.
Initial download of the metrics may take a while.