Fig. 2.
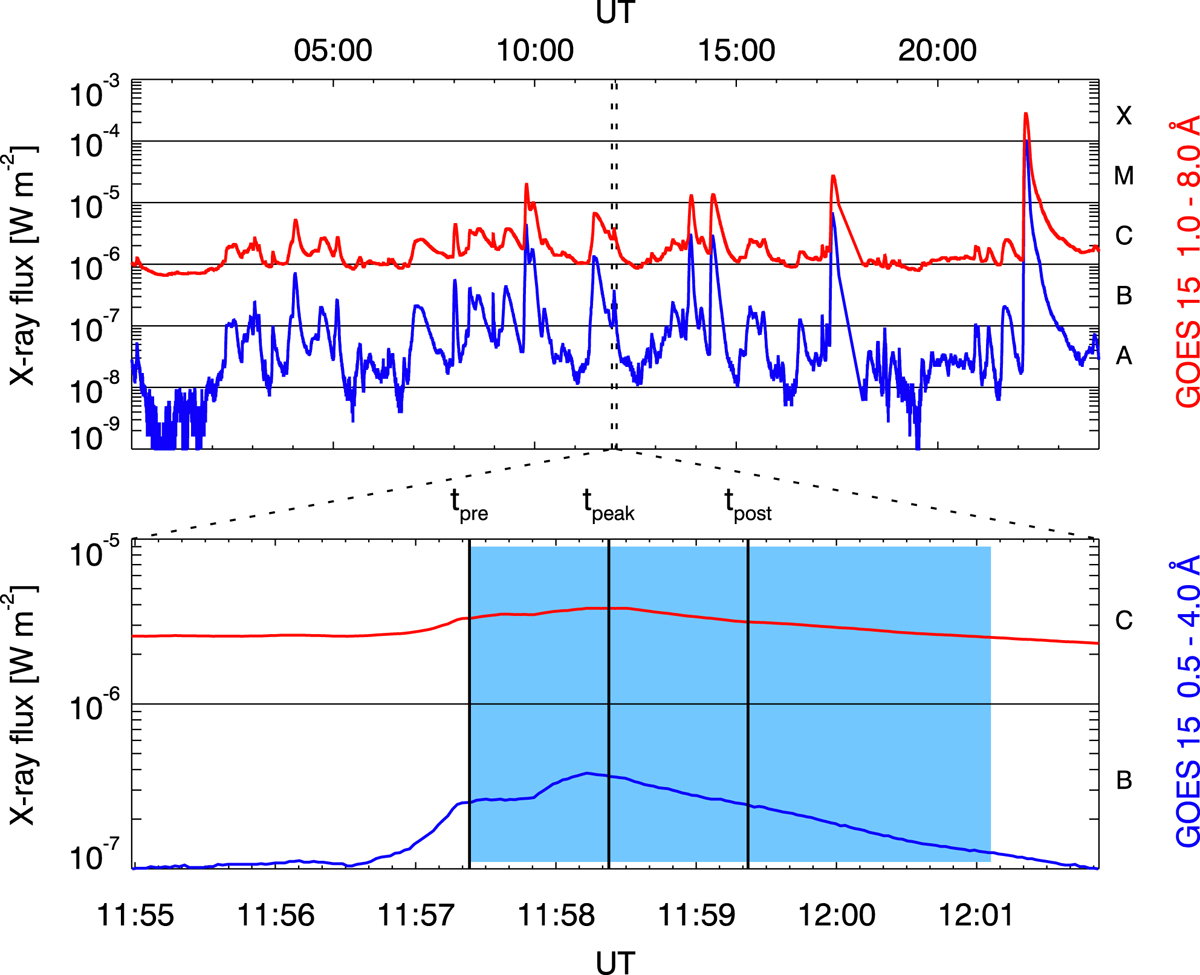
Time evolution of the X-ray flux as measured by the GOES satellite in channel 1.0–8.0 Å (red) and 0.5–4.0 Å (blue). Upper panel: X-ray flux for the entire day 2015-05-05. Lower panel: C3.6 class flare in AR 12335. The blue area indicates the time of SST observation. The black vertical lines show the times of the three scans that we have used in our inversions, referred to as tpre, tpeak and tpost.
Current usage metrics show cumulative count of Article Views (full-text article views including HTML views, PDF and ePub downloads, according to the available data) and Abstracts Views on Vision4Press platform.
Data correspond to usage on the plateform after 2015. The current usage metrics is available 48-96 hours after online publication and is updated daily on week days.
Initial download of the metrics may take a while.