Fig. B.1.
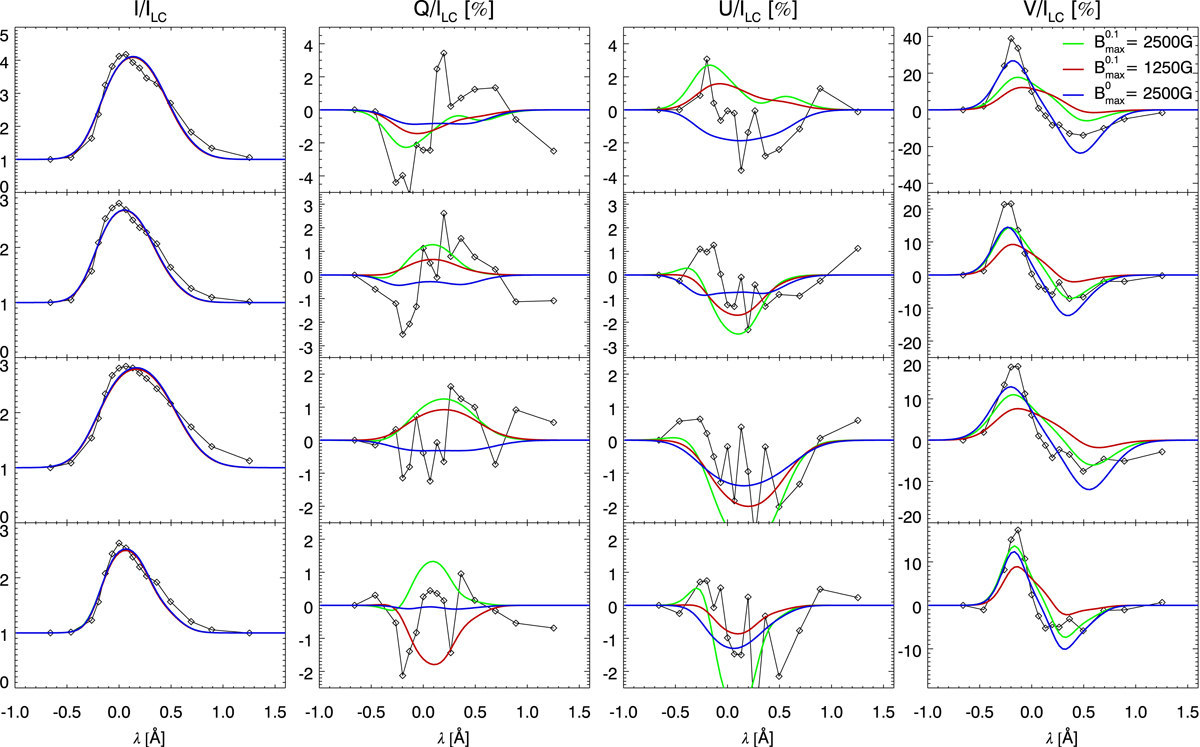
Inversion results for the test cases shown in boldface in Table B.1 for a model using one slab in HAZEL. The observational data is shown as a black line. Diamonds show the wavelength sampling of the observation. The green, red, and blue lines correspond to the fits obtained using the different upper values for the magnetic field Bmax and different values for the atomic orientation defined by ![]() . The value for atomic orientation is given by a superscript to Bmax. All profiles are normalized using the local continuum ILC.
. The value for atomic orientation is given by a superscript to Bmax. All profiles are normalized using the local continuum ILC.
Current usage metrics show cumulative count of Article Views (full-text article views including HTML views, PDF and ePub downloads, according to the available data) and Abstracts Views on Vision4Press platform.
Data correspond to usage on the plateform after 2015. The current usage metrics is available 48-96 hours after online publication and is updated daily on week days.
Initial download of the metrics may take a while.