Fig. 12.
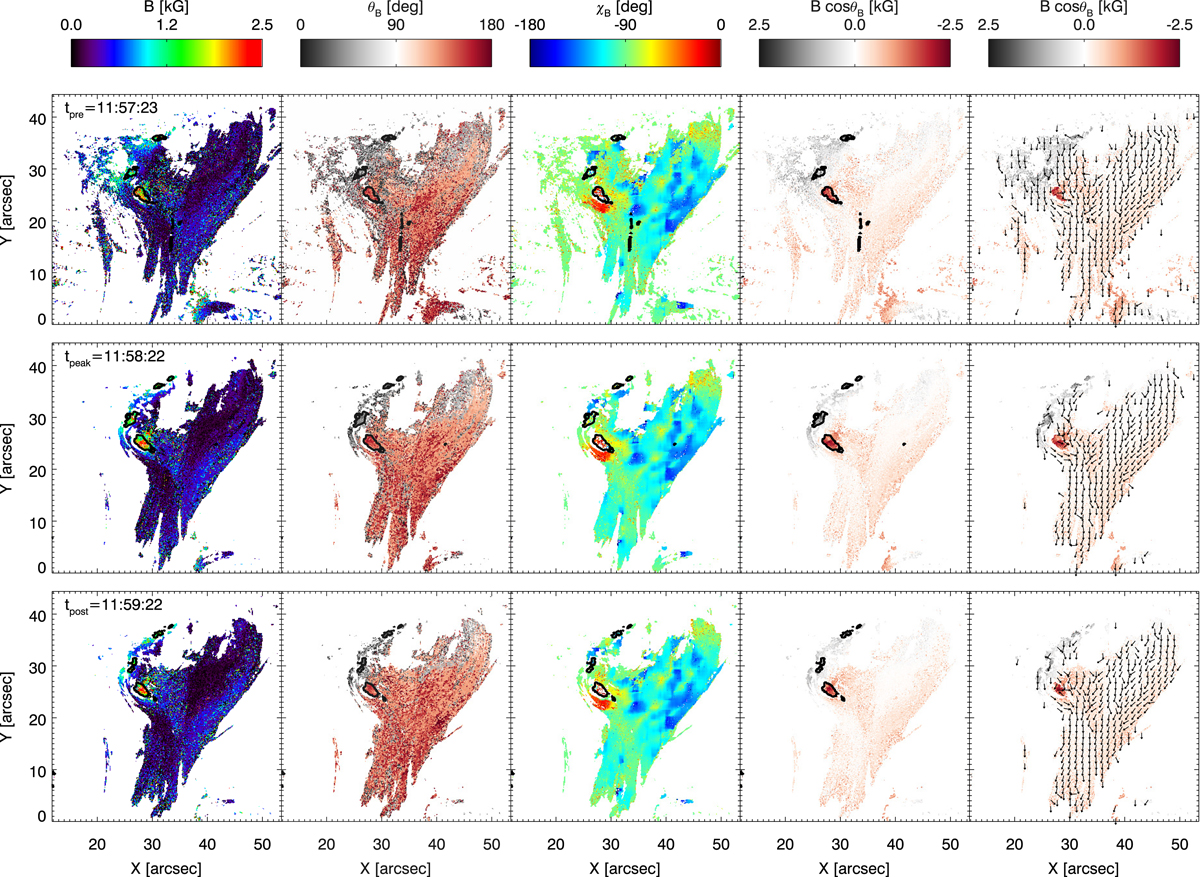
Inversion results on 2 × 2 rebinned data of the magnetic field with respectively from left to right: the magnetic field value B, the inclination θB, the azimuth χB (input value determined by fibril orientation), the vertical magnetic field B · cosθB and the vertical magnetic field with arrows overplotting the azimuth direction. The three rows represent three different time steps, from top to bottom: tpre, tpeak and tpost. The black contours indicate the emission profiles. The emission profiles have been inverted using two components, of which the blue component is shown here.
Current usage metrics show cumulative count of Article Views (full-text article views including HTML views, PDF and ePub downloads, according to the available data) and Abstracts Views on Vision4Press platform.
Data correspond to usage on the plateform after 2015. The current usage metrics is available 48-96 hours after online publication and is updated daily on week days.
Initial download of the metrics may take a while.